Litecoin (LTC/USD) has soared more than 9% in the past 24 hours, trading as high as $84.97 on US cryptocurrency exchange Coinbase early Monday. The upside brought LTC price to its highest level in seven months, on-chain data platform Santiment highlighted in a tweet. Indeed, the buy pressure for the digital silver makes it the […]
Excitable speculators mistakenly rushed to invest in the native token of decentralized finance protocol Curve Finance (CRV) after reports emerged that payments giant PayPal has acquired the unrelated Israel-based crypto custody firm, Curv.
News of PayPal’s Curv acquisition was reported on March 2, with the publications citing anonymous sources “familiar with the matter.” Israel-based media has reported the company may have been sold for between $200 million and $300 million.
Within an hour of the news breaking, Curve’s CRV token had rallied by more than 10% as opportunistic traders raced each other to enter the markets — pushing prices up from roughly $2.30 to $2.60.
The official Twitter account of Curve has also been mistakenly tagged in numerous posts celebrating PayPal’s acquisition, to which Curve has responded in a bid to dispel the confusion:
The correct account for that is @curvmpc, not us
— Curve Finance (@CurveFinance) March 2, 2021
CRV quickly reversed the rally to give back all of its gains as traders realized their mistake. The resulting red candlestick was CRV’s largest hourly candlestick by trade volume since Jan. 21.
However, all publicity is good publicity and despite the confusion, CRV has since bounced off support at $2.20, and last changed hands for $2.60 to post a gain of 29% over the past 24 hours. As such, CRV currently ranks as today’s best-performing Ethereum-based asset, according to market data aggregator Messari.
CRV/USDT, hourly chart since Jan. 14: TradingView
This is not the first time fools have rushed in to buy the wrong ticker. In January, confused traders rallied around the New York Stock Exchange-listed Tanzanian Gold Corporation (TRX) after Justin Sun’s Tron cryptocurrency (also TRX) was promoted to traders in the notorious r/WallStreetBets group.
Justin Sun was shilling his shite token TRX to the WSB subreddit but they bought the Tanzanian Gold Corp (which is the TRX stock) instead pic.twitter.com/Q5CW4znqai
— ∞ CO฿IE (@CryptoCobain) January 30, 2021
The debacle saw daily trade in Tanzanian Gold Corporation’s stock increase by nearly 84 times on Jan. 29, spiking from an average daily volume of 584,000 shares to 49 million. The day saw TRX stock prices rally from $0.85 to more than $1.90, before collapsing to close the day at a roughly 15% loss.
This week, transaction fees on the Ethereum blockchain grew to a level that made the decentralized applications (dapp) operating atop it practically unusable. In some cases, transferring as little as $5 across the second-largest public chain started costing as high as $300.
With no choice left, many of the dapp developers decided to run the same operations on a rivaling blockchain network, the Binance Smart Chain, a public ledger that offered to do the same tasks Ethereum does at 99 percent lesser costs. On Wednesday, the BSC blockchain processed about 2.12 million transactions compared to 1.26 million on Ethereum.
The strong shift also appeared as PancakeSwap, a UniSwap ripoff launched atop the BSC blockchain, rivaled Ethereum-based decentralized exchanges, driving a 1,000 percent-plus liquidity surge this year, accompanied by strong volumes—from $37 million on Jan. 1 to $1.68 billion on Feb. 19.
Meanwhile…
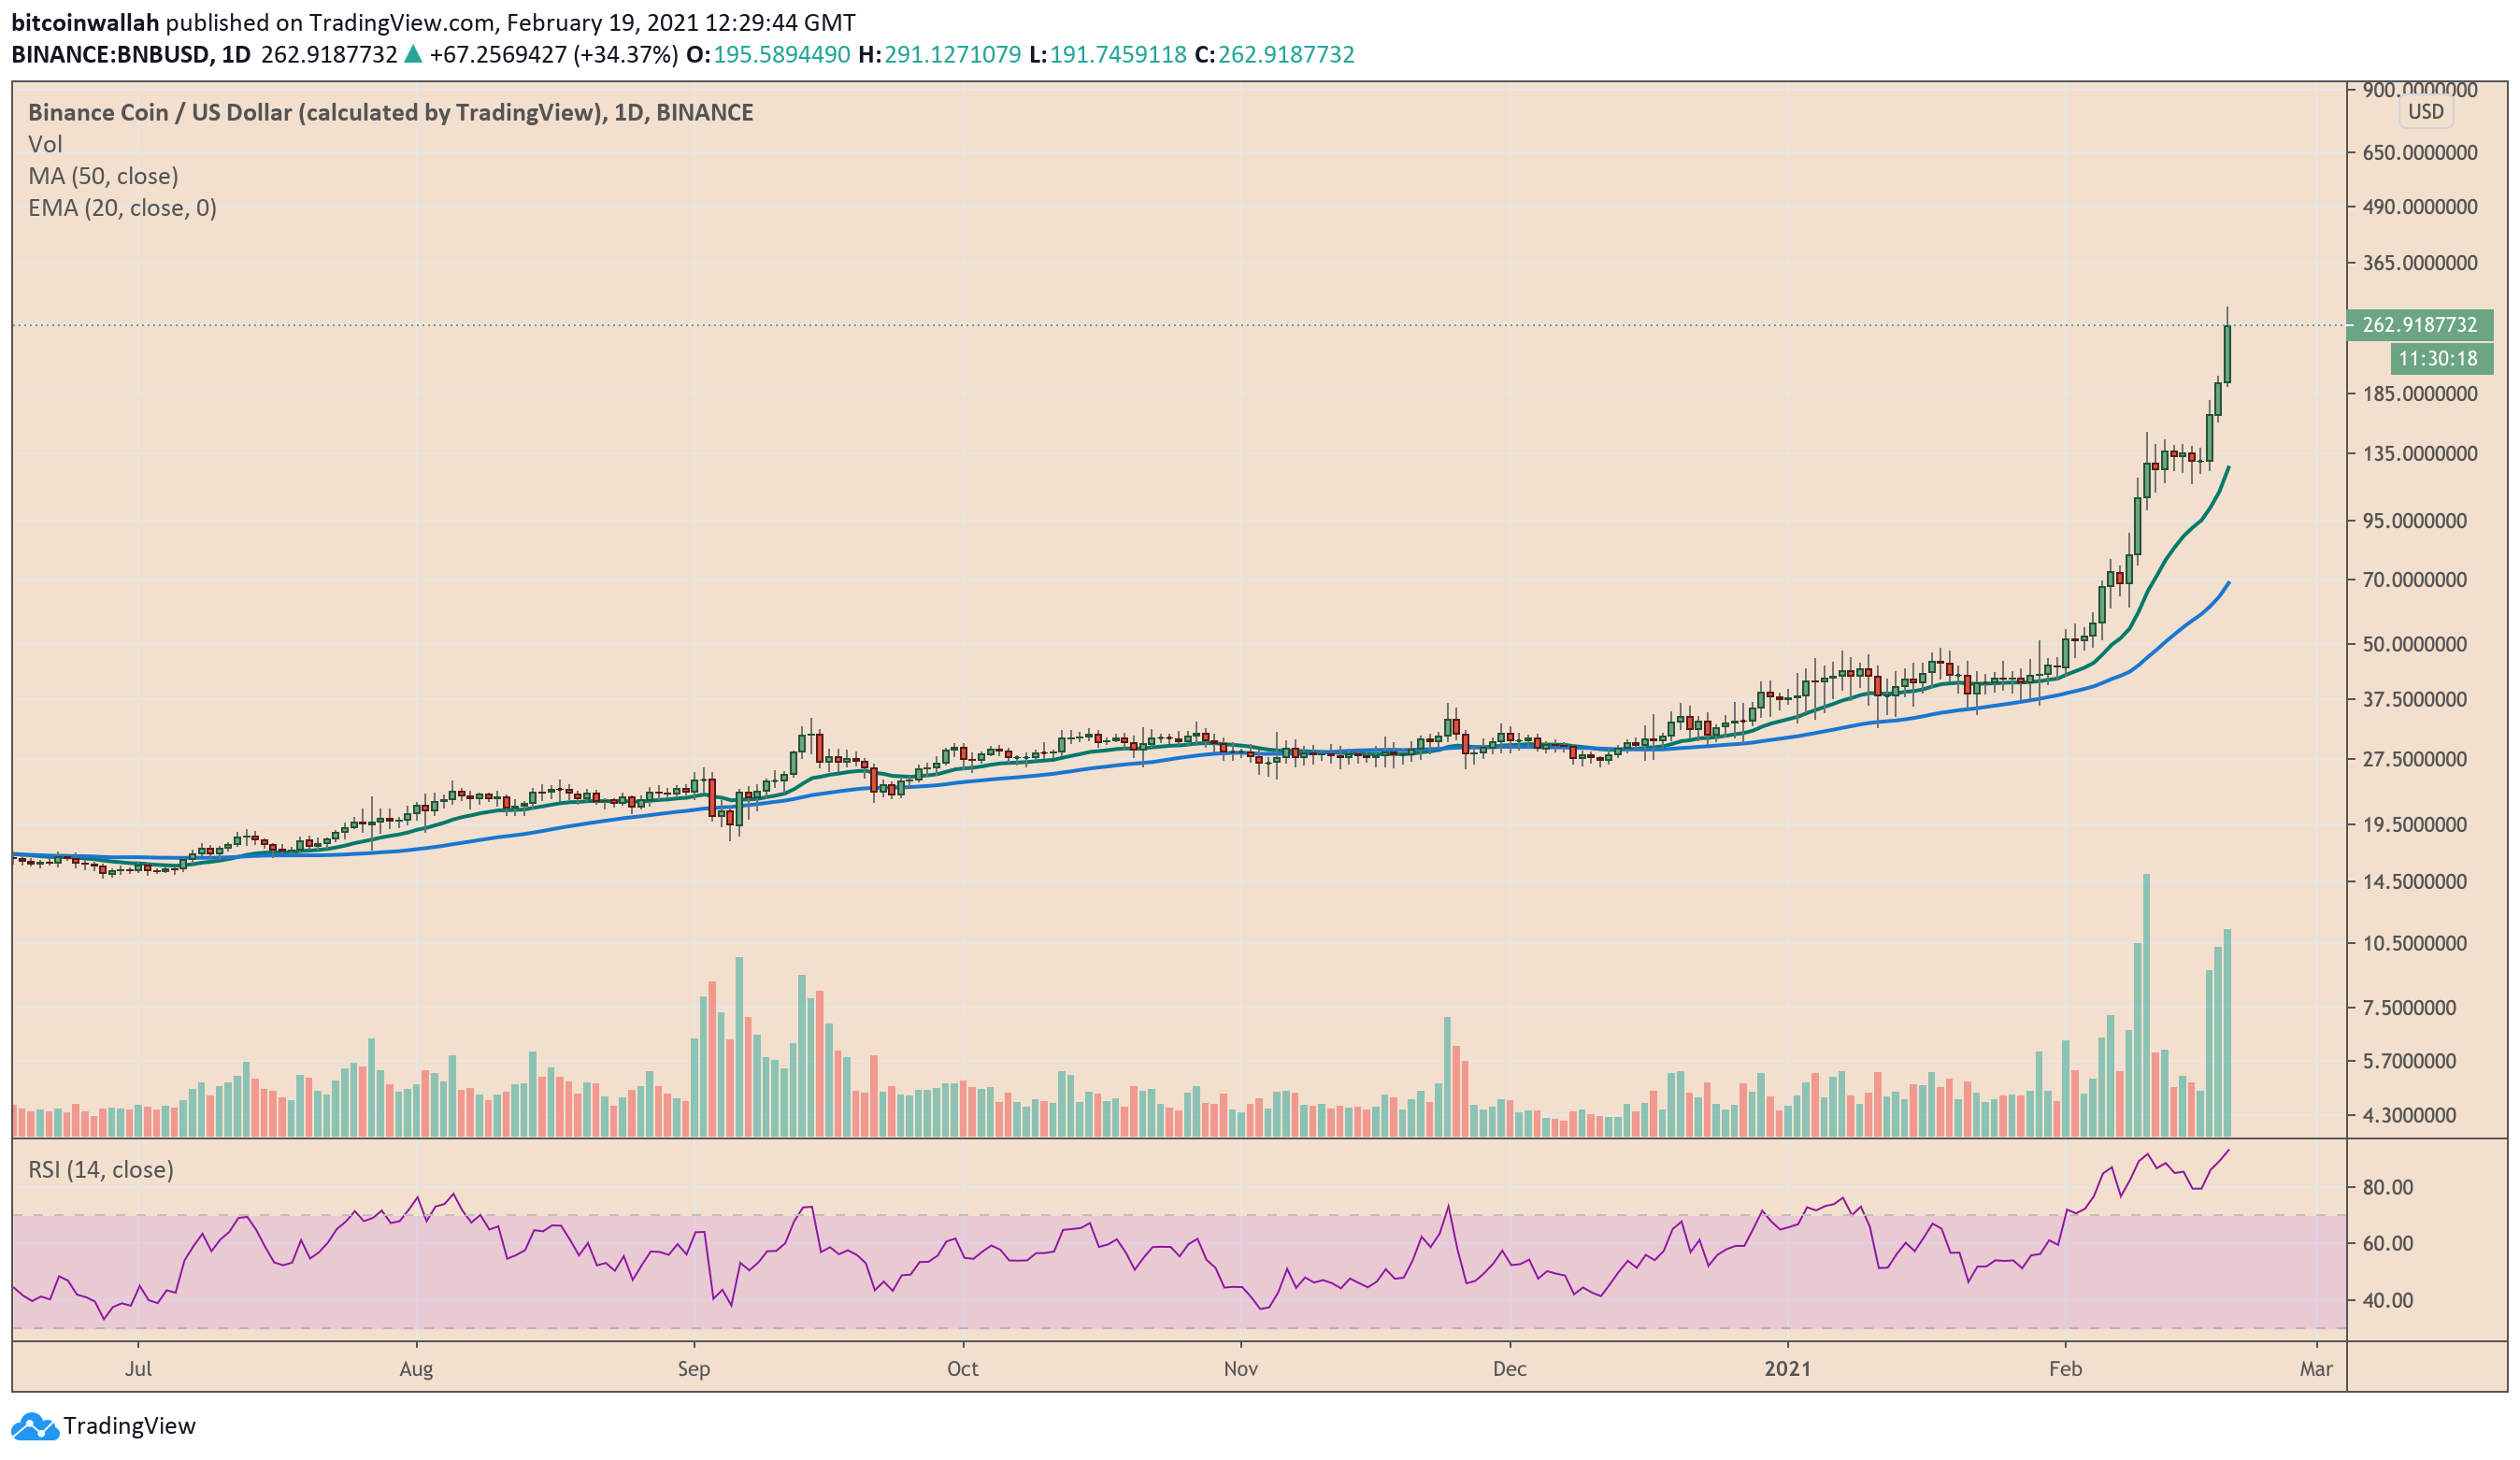
…Binance Coin (BNB/USD), a native token in the Binance’s ecosystem, was always at the center of BSC’s developments. Its prices in the US dollar market surged from $42 on January 1 to as high as $291 on January 19. Traders merely saw holding opportunities by taking cues from the Binance’s expansion into Ethereum’s turf.
.@Uniswap should consider moving to #BSC. Not easy running with weight on your ankles. Follow the users.
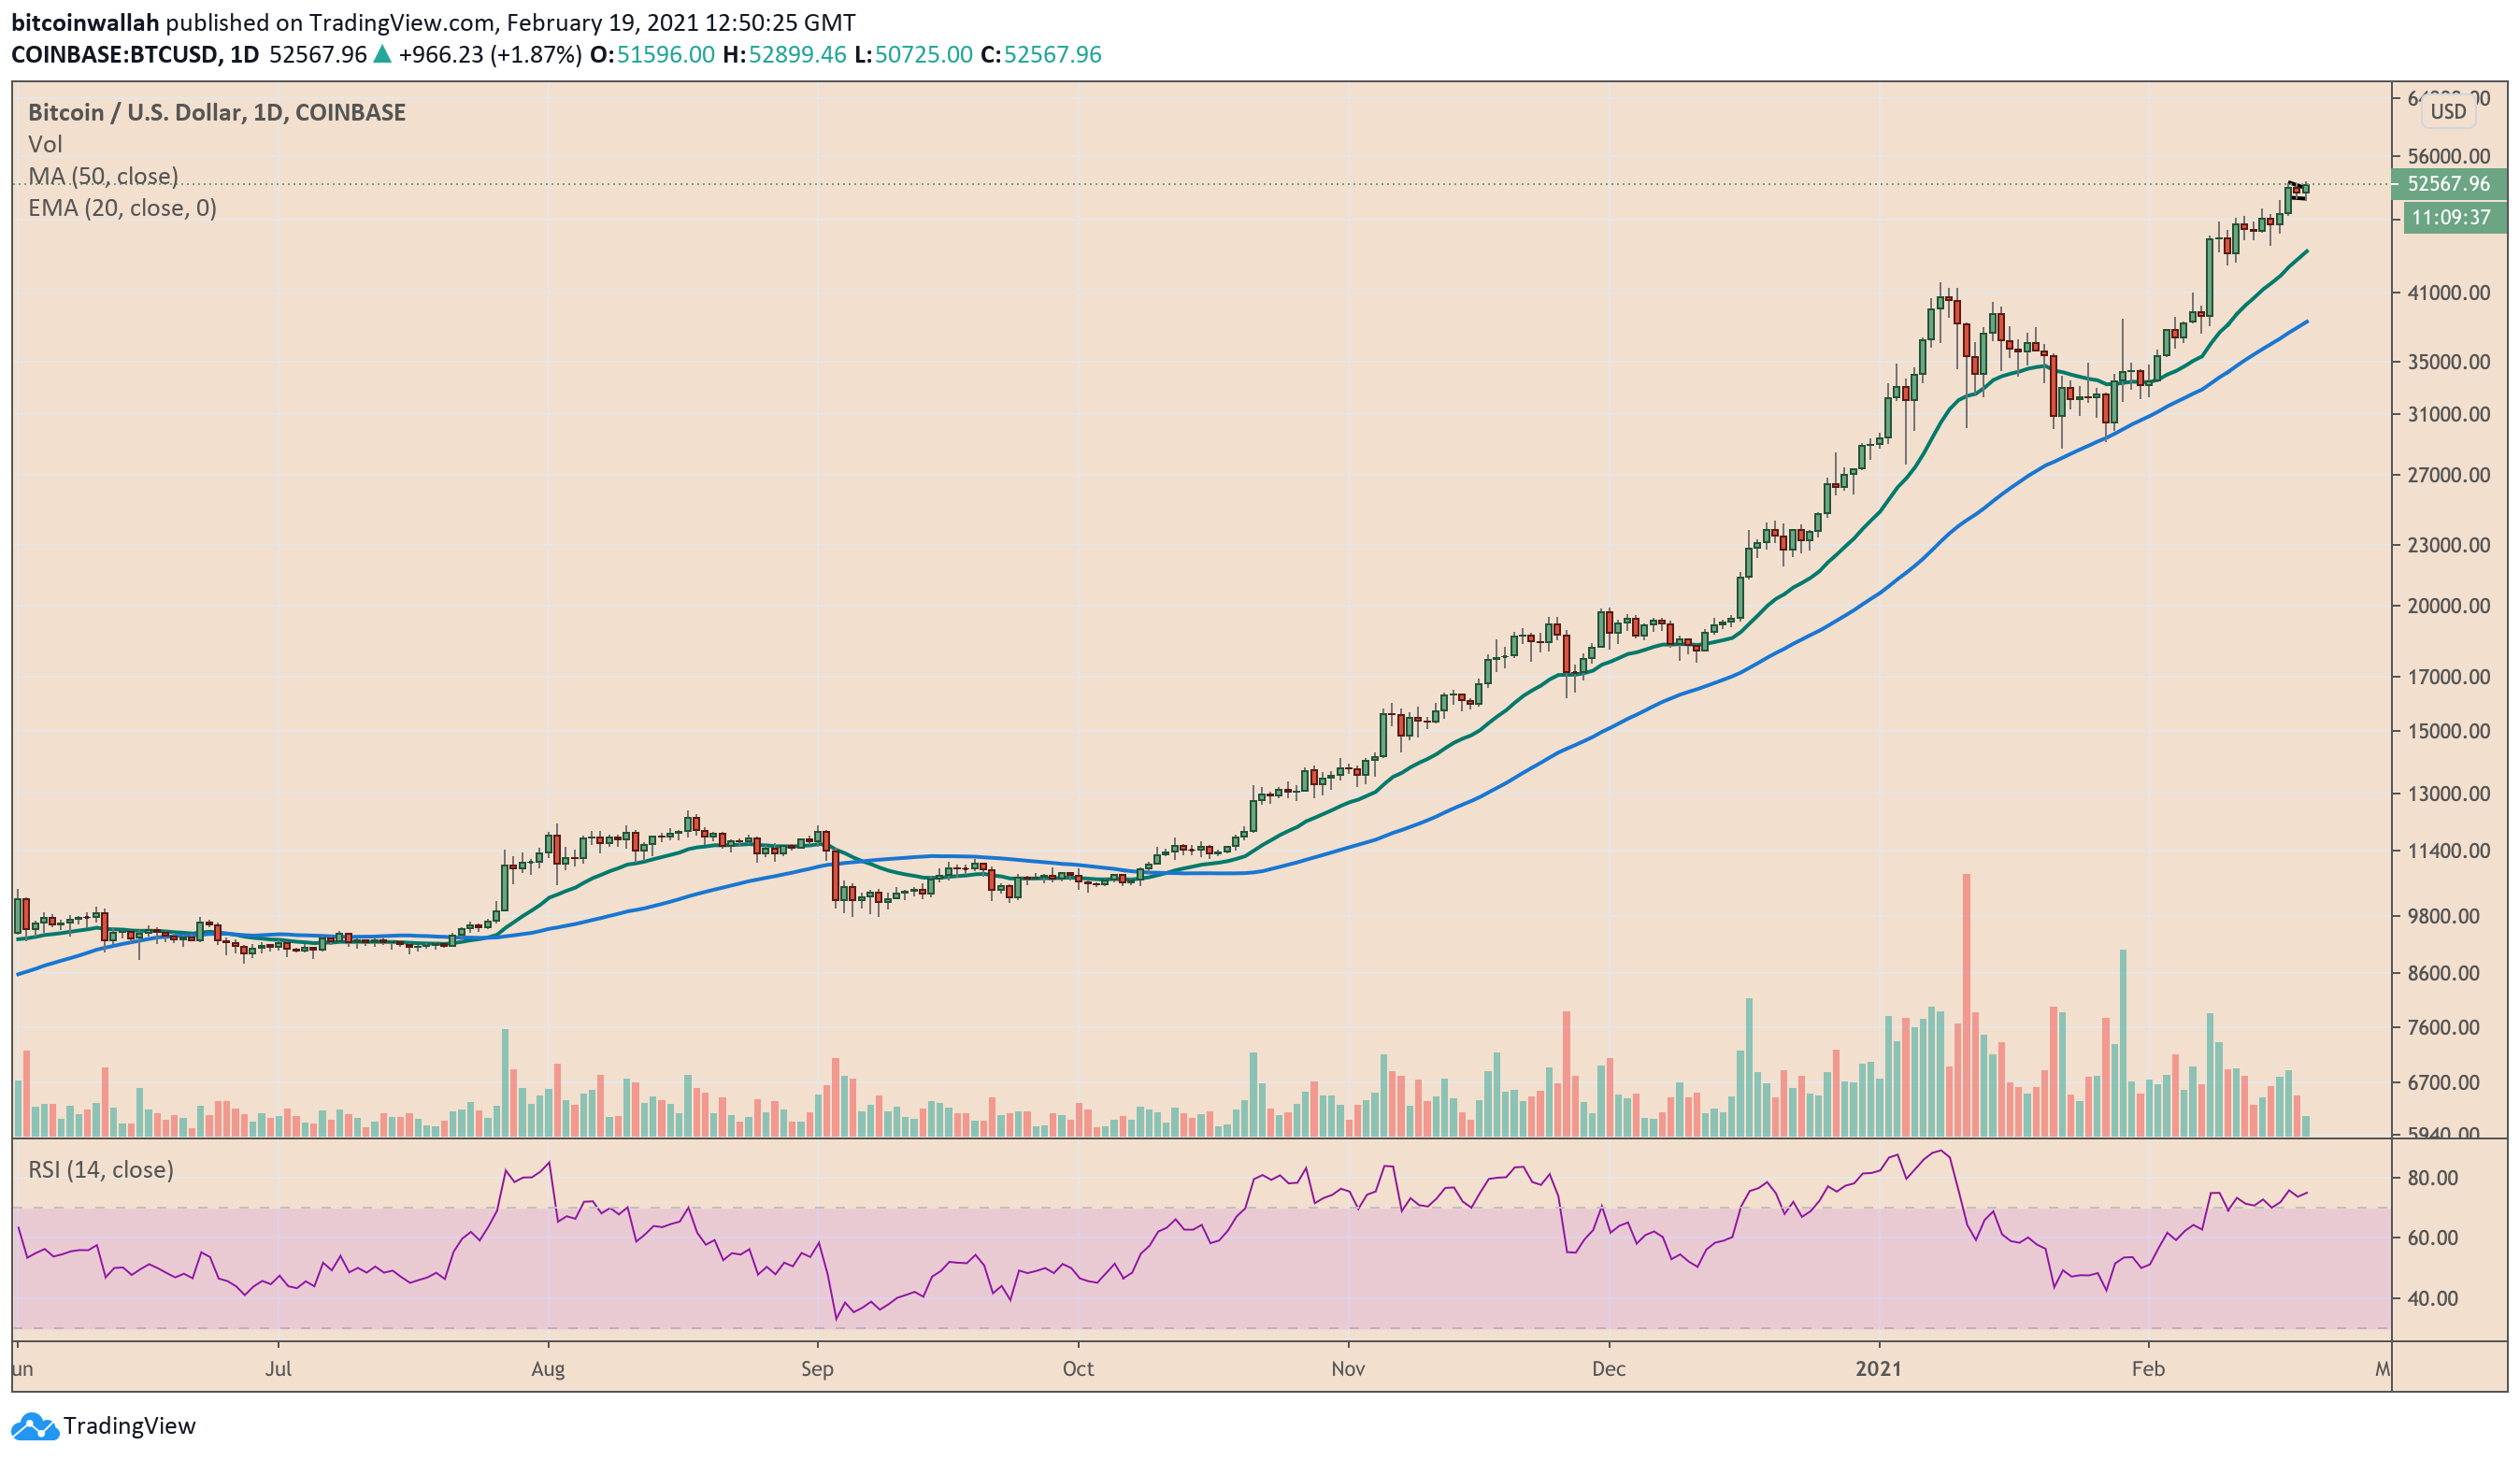
More tailwinds for Binance Coin also come from the prospect of an overall crypto boom, led by Bitcoin’s meteoric rise in the last eleven months. The flagship cryptocurrency surged by more than 1,200 percent from its mid-March nadir of $3,858 as institutions realized its safe-haven credentials amid an uncertain global economic outlook.
Corporate houses, including Tesla, MicroStrategy, Square, and Bitwise, bought billions of dollars worth of Bitcoin to diversify their balance sheets with cash alternatives. Meanwhile, billionaire investors such as Paul Tudor Jones and Stan Druckenmiller also promoted cryptocurrency as digital gold— a hedge against a depreciating US dollar.
Bitcoin hits an all-time high. Source: BTCUSD on TradingView.com
As crypto adoption surges, it increases sign-ups across all the cryptocurrency exchanges. Meanwhile, that boosts Binance Coin’s adoption against its depleting supply rate.
Ethereum’s realized capitalization has increased by nearly 50% in January so far to tag new all-time highs above $70 billion, according to CoinMetrics.
The data shows that Ethereum’s realized cap has more than tripled since dropping below $25 billion in during March 2020’s “Black Thursday” crash..
Ethereum’s realized cap: CoinMetrics
The realized capitalization metric calculates the value of a crypto asset’s supply according to when each unit last moved on-chain. The indicator seeks to estimate the price actually paid for each ETH in circulation — rather than simply multiply the current price by the total supply as market cap does. However, realized cap cannot account for coins that are only traded on centralized exchanges and do not move on-chain.
The indicator is designed to offer a way to compensate for lost or unclaimed coins by ignoring their appreciation from the time each unit was last transferred on-chain.
By ignoring the fluctuating capitalization of dormant coins, realized cap offers a signal for when new capital is flowing into a given market, with CoinMetrics inferring that many new investors may have been buying the bags of seasoned ETH whales during January’s bull market.
The report also noted a 5% spike in the number of Ethereum addresses holding more than 10,000 Ether, with 1,241 wallets currently holding $13.8 million or more in ETH. As such, CoinMetrics concludes that “institutional investors are starting to buy ETH.”
The growth of Ethereum’s realized cap appears to have outperformed that of Bitcoin’s last year, with Glassnode reporting that BTC’s realized cap had grown 50% since the beginning of 2020 as of Dec. 15. CoinMetrics’ data indicates Ethereum had seen an 85% increase over the same period.
Blockchain Center’s Flippening Index currently estimates that Ethereum is 71% of the way to surpassing Bitcoin according to eight key metrics — comprising a new all-time high for the indicator.
The index notes Ethereum has already surpassed Bitcoin by transaction fees and transaction count, and estimates that transaction volume and node count are at 99% and 97% of Bitcoin’s respectively.
The price of Bitcoin (BTC) increased from $12,920 to $13,600 in four hours, recording a 5% rally. The uptrend coincides with positive developments from the European Central Bank, or ECB, and optimistic job data from the United States.
Throughout the past week, BTC has continuously rallied despite negative macro factors. The U.S. stock market was in a steep decline, and the number of COVID-19 cases across the U.S. and Europe rose sharply.
The perception of Bitcoin as a safe-haven asset is noticeably strengthening due to the rise in institutional demand. But when risk-on assets, such as stocks, are declining, they could place indirect pressure on BTC.
As such, when stocks rally and risk-on assets thrive, the short-term outlook for the price of Bitcoin improves.
On Oct. 29, there were several events that caused risk-on assets to increase. First, the ECB said it might seek a new stimulus package in December. Second, U.S. job data reflected the lowest weekly claims since the start of the coronavirus pandemic.
A second stimulus package in Europe achieves two things. First, it would massively increase the appetite for risk-on assets in Europe. Simultaneously, it would place pressure on the U.S. to deliver a much-needed stimulus deal.
Since U.S. President Donald Trump has made his position clear that a stimulus package will come after the election, this sets the U.S. up for a December stimulus deal.
The ECB said it would consider all possibilities in ensuring the sustainability of the economy. This benefits Bitcoin, gold and stocks altogether, as evidenced by the price of BTC. The ECB said:
“The Governing Council will carefully assess the incoming information, including the dynamics of the pandemic, prospects for a rollout of vaccines and developments in the exchange rate.”
Christine Lagarde, the president of the ECB, also emphasized that the institution acted promptly when the first wave of COVID-19 hit. Hinting that a second stimulus deal could arrive, she said:
“We have done that in the past: We have responded very promptly, very appropriately, very heavily, some would say, to the first wave that hit the euro area economies. We have done it for the first wave; we will do it again for the second wave.”
BTC prevented a bigger move down to the $12,700 area
When the price of Bitcoin moved below $13,000, technical analysts said BTC is at risk of dropping to $12,700 and lower.
The $13,000 level has acted as a strong support area, backed by whale clusters and large by orders. BTC defending the area indicates buyer demand is overwhelming selling pressure, as seen in the futures market.
The funding rate of the Bitcoin futures market has remained negative throughout the past several days. It suggests that the majority of the derivatives market is seemingly betting against BTC.
Yet, the demand for Bitcoin from the spot market is offsetting the selling pressure and defending BTC against further downside.
High gas prices have become a problem for non-fungible token (NFT) marketplaces, especially as they look to mint at scale, the founder of a start-up said.
Sean Papanikolas, founder of NFT marketplace Cargo, told Cointelegraph in an interview that the NFT sector is at an inflection point. But scalability weighs on new players in the sector now that gas prices have spiked. He said:
“Now, in 2020, platforms are starting to see the scaling issue now due to the spikes in gas prices. Some platforms have halted minting while gas is high and other platforms see a major decline in activity.”
High gas prices have caused some platforms to start working on layer-2 solutions and some are eyeing other chains, leaving Ethereum altogether, warned Cargo’s founder. To counter higher gas fees, Papanikolas said Cargo launched a solution based on ERC-721 and ERC-2309 standards.
But if blockchain companies want to expand their businesses within the NFT landscape, Papanikolas warned it’s not going to be as easy as they think:
“I think blockchain companies need to be prepared for the level of software engineering effort it will take to overcome the technical hurdles and the limitations of smart contract development on Ethereum and then how those pieces will work with traditional systems. The competition will continue to increase as well.”
Currently, users can spend a small amount of Ether (ETH) at current prices to secure gas that can be used later without the risk of the price going up. This is something other industry players have talked about in the past. In a previous interview with Cointelegraph, Qtum co-founder and lead developer Jordan Earls said this causes the network “to not respond properly to an increase in gas prices like we see today, as some people with access to these tokens ca use this cheap gas now, but also get their transaction highly prioritized without actually spending any ETH.” Other companies also pointed out that NFT firms are exploring other means to avoid high gas prices.
Digibyte (DGB) price has seen some rather strong surges in 2020, followed by just as strong drops.
The coin reached its YTD high in August, and since then, it has struggled to reclaim that level.
Right now, it is in the middle of another rally, followed by occasional corrections.
Digibyte (DGB) has seen a significant price growth over the last week, and especially in the last 24 hours. The project is heading back to its YTD high, and while there is still some way to go, the progress is certainly being made.
Digibyte in 2020
Digibyte’s YTD chart shows a rather unique price performance, still featuring ups and downs in tandem with the rest of the market, but one look shows that Digibyte seems to be following its own path most of the time.
In the early days of 2020, the project’s price stood at $0.005255, and while its growth did start soon after that, it was rather mild compared to the rest of the crypto world.
Around February 14th, Bitcoin and the rest of the market reached a peak of the bull run, and then they started to drop. Digibyte followed this trend, although its mid-March price crash wasn’t nearly as severe as that of the rest of the market.
DGB then started seeing mild recovery, going from its new bottom at $0.003083 to $0.006395 in April. What followed was a mild correction, which then turned into a major price surge that took it all the way up to $0.025546 in only a month.
Investors started buying DGB rapidly during this month, between early April and early May. However, after reaching the mentioned peak, DGB saw a corredtion, followed by a struggle to once again reach this level and breach it.
The coin finally did it in early August, and the breach caused an even higher surge to $0.047626 by August 15th.
A correction and a new spike up
At this point, DGB has reached its highest point in 2020 to date. However, soon after that, a correction started, taking it back to a support just above $0.02. The coin remained there until September 15th, recovering and gathering strength for a new surge.
This new spike started on September 15th, and it still continues to push the coin up, one week later.
This Monday, September 21st, the coin managed to climb back up to $0.03, and once again breach this level. The breach was temporary, and it caused a mild correction yet again, but DGB now once again turned the tables, and is currently growing by 3,60%.
Looking at ETH/USD 1H chart shows the pair attempting to close above $384, a resistance target that had held through extreme bullish biases in the past. It continues to defend bears as Ethereum traders repeatedly fail to push the prices above, leading to the formation of multiple lengthy wicks to the upside.
ETHUSD trades near the interim resistance area of $384-390. Source: TradingView.com
ETHUSD trades near the interim resistance area of $384-390. Source: TradingView.com
That leaves traders with the option to either keep testing the level for a breakout move while gathering more accumulators at the local support level ($375) or give up the area altogether to find serious buyers at further lower levels.
Breakout Scenario
As shown in the chart above, Ethereum is technically trading inside an Ascending Triangle. A horizontal line/area in purple coupled with a rising trendline with more than two higher lows attests to the technical pattern.
An Ascending Triangle is a continuation signal, which means that traders expect it to push the price in the direction of its previous trend. Once the breakout occurs, they open buy or sell positions depending on the direction of the price move. The length of the breakout, meanwhile, is typically the same as the maximum height of the Triangle.
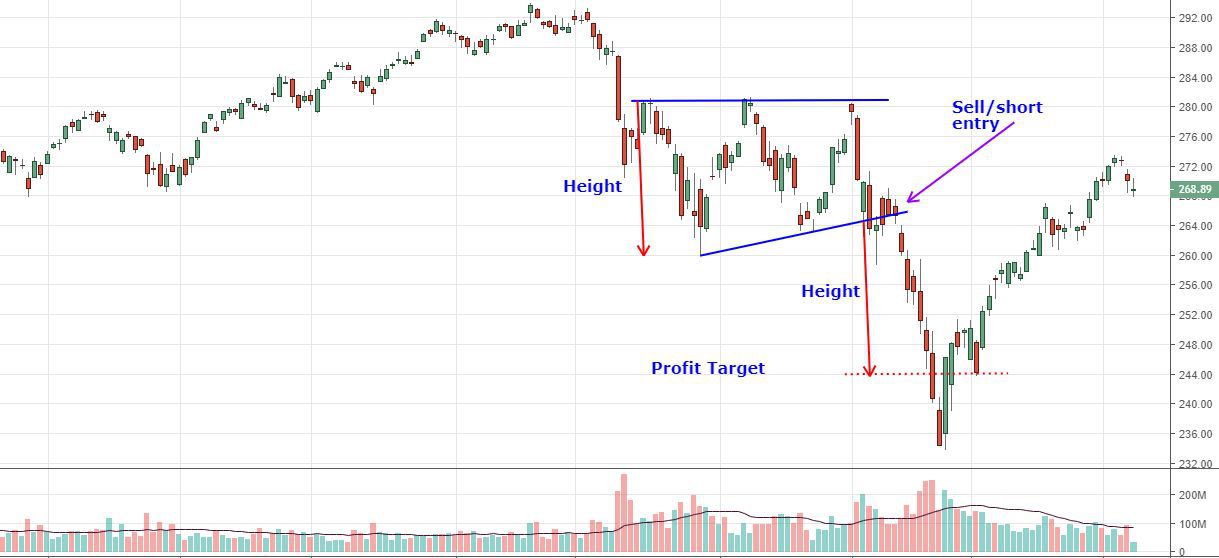
Example of Ascending Triangle breakout in a downtrend. Source: Investopedia
Example of Ascending Triangle breakout in a downtrend. Source: Investopedia
Ethereum has more probability of breaking to the downside, given the trend before the Ascending Triangle formation was bearish. Should that happen, the cryptocurrency will pull back after failing to break above the $384-390 resistance area to retest the rising trendline (green) as support.
That price floor currently sits near $350, a psychological level for the next potential rebound.
Nevertheless, a negative breakout will occur if the Ethereum price breaks below the green trendline. That would mean an extended downside move – of about $67 based on the maximum height of the Triangle. All and all, ETH/USD risks falling to $283 if the bearish pattern holds valid.
Ethereum Bullish Scenario
Conversely, if Ethereum manages to break above the $384-390 range, then it would eye an extended upside momentum towards $450 or above. That would also mark a trend reversal. It means ETH/USD could pursue further upside targets by flipping $384-390 from a resistance area to support.
“Ethereum is essentially trapped in between two important Quarterly levels $360 and $391,” said an analyst. “Its Quarterly candle closes in less than two weeks. A close above $360 could be enough to preserve ETH’s bullish momentum and avoid the further downside.”
ETH/USD was up 4.45 percent ahead of the New York trading session Thursday.