Categories
News

[Aim Rich Investment Strategy] Bitcoin transaction volume increases again… Market to continue strong (www.blockcast.cc)

Aim Rich Cryptocurrency Investment Information (2021.3.11)
<Figure 1=Market trend score as of 14:00 on the 11th (100 points, left)/Market rise/fall intensity (right)/Data=Aim Rich Financial Engineering Research Institute>

◆Cryptocurrency market conditions <neutral>

Bitcoin (BTC), the number one cryptocurrency market capitalization for the past 24 hours, continues to be bullish, exceeding the $57,000 mark during the intraday, and is undergoing a sale process, and can reach $60,000 beyond the previous high of $58,000. It is noted whether there will be. Some analysts have raised their short-term price outlook for Bitcoin (BTC) to $60,000, raising expectations for a full-fledged bull market turnaround.

According to the Institute’s on-chain transaction volume index analysis (refer to “Analysis of Bitcoin Transaction Volume on the Day” on page 11), the Bitcoin spot transaction volume on major exchanges, which had declined as the market price rose, turned to an increase since last Tuesday, leading to an upward trend. It is expected to be further strengthened.

Last night, on the back of sound US inflation and new stimulus measures, the US Dow index broke the record for the first time in history, breaking the 32,000 mark, but the Nasdaq index, which focuses on technology stocks, fell slightly. This is due to the sluggishness of big tech stocks such as Tesla (-0.82%), Apple (-0.91%), Amazon.com (-0.17%), NVIDIA (-0.42%), and Microsoft (-1.36%).

As of 14:00 on the 11th, the price of bitcoin based on CoinMarket Cap is $55,640.50, the 24-hour trading volume is about $52.8 billion, and the market cap is about $1.4 trillion. The total cryptocurrency market capitalization is USD 1.74 trillion, the Bitcoin market cap share is 61.0%, and the Ethereum market cap share is 12.2%. The total cryptocurrency market capitalization decreased by 0.08% compared to the previous day, and the market cap excluding bitcoin increased 0.23% compared to the previous day, making it stronger than altcoin compared to bitcoin, and the market cap of bitcoin decreased 0.26% compared to the previous day. The market share of Bitcoin decreased by 0.19% compared to the previous day, and it was analyzed that the decline rate of bitcoin was greater than the average decline rate of altcoins.

<Figure 2=Status of Real-Time Cryptocurrency Market/Data=Aim Rich Financial Engineering Research Institute>

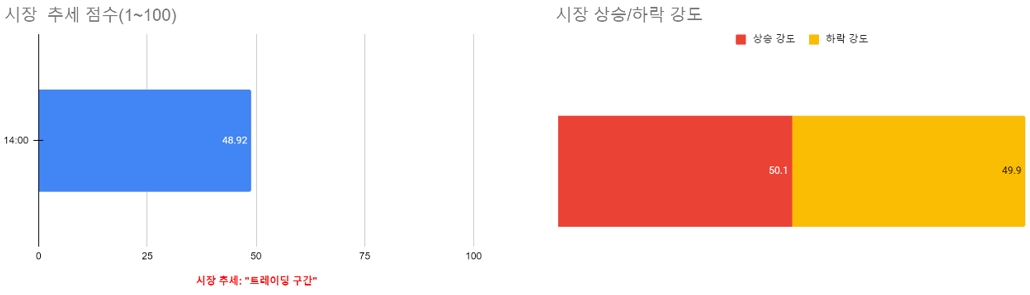
On the other hand, according to the Weiss Crypto Index, the market that had been going back and forth was stronger as buying and selling prices alternated after opening.As of 14 o’clock, in the market on the same day, the selling tax for bitcoins was stronger than altcoins. Was analyzed to be high.

As of 14:00, W50, a cryptocurrency market index including bitcoin, is +0.56%, W50X, a cryptocurrency market index excluding bitcoin, is +0.87%, WLC, an index centered on large stocks, is +0.50%, and an index centered on medium-sized stocks. WMC recorded +0.94% and WSC, an index centered on small stocks, recorded +0.41%.

<Figure 3=Longs/Shorts cumulative trading volume ratio of major exchanges in the past 24 hours/Data=Aim Rich Financial Engineering Research Institute>
<Table 1=Ratio of Longs/Shorts trading volume of major exchanges as of 14:00 on the 11th/Data=Aim Rich Financial Engineering Research Institute>

As of 14:00 on the 11th, the ratio of buy:sell cumulative transaction volume for the past 24 hours was 46%:54%, which showed a high selling ratio, and as of 14:00, the long/short ratio of each exchange was also analyzed to be strong on average. . (Refer to Table 1)

At the same time, on the cryptocurrency derivatives exchange BitMEX, the basis of bitcoin futures was around +76.0, and the basis of Ethereum futures was around +4.45. The price of bitcoin futures on the Chicago Merchandise Exchange (CME) is falling. March futures traded at $56,385.0, down $235 (-0.42%) from the previous day.

◆Main Cryptocurrency Prices <Neutral>

As of 14:00 on the 11th, the domestic bitcoin (BTC) price rose 0.19% from the previous day to 64.47 million won, Ethereum (ETH) rose 0.39% to 2.88 million won, and Polkadot (DOT) fell 1.04% to 42,850 won. did. Ada (ADA) was 1,305 won as of the previous day, Ripple (XRP) fell 1.13% from the previous day to 527 won, Bitcoin Cash (BCH) rose 1.60% to 640,000 won, and Stellar Lumen (XLM) fell 0.21% to 469 won. , Chainlink (LINK) is trading at 33,950 won, down 1.57% from the previous day, and Litecoin (LTC) is trading at 228,000 won, down 0.91%.

<Figure 4=Upbit BTC/KRW Daily Chart/Data=Trading View>
<Figure 5=Top 10 Coin Price (As of March 11, 14:00)/Image=Coin Market Cap>

At the same time, the global cryptocurrency market price based on coin market cap is rising, as of 24 hours ago, 5 of the top 10 stocks by market capitalization. The international Bitcoin (BTC) price is $55,640.50, up 3.30% from the same time the day before. Ethereum (ETH) rose 1.35% to $1,809.09, while Binance Coin (BNB) rose 3.15% to $283.63. Cardano (ADA) fell 2.15% from the previous day to $1.13, Polkadot (DOT) rose 1.00% to $37.00, Ripple (XRP) rose 1.63% to $0.4576, Uniswap (UNI) fell 3.03% to $30.60, Light Coin (LTC) rose 1.74% to $199.11, and Chainlink (LINK) fell 2.09% to $29.43.

◆ Analysis of major media and market experts <neutral>

In the market, the participation of large institutional investors, including the notable purchases of some companies such as Tesla, Square, and MicroStrategy, and easing monetary policies such as low interest rates and asset purchases by central banks around the world have eroded the value of fiat currencies such as the US dollar. On the other hand, the analysis that Bitcoin perceived as an inflation hedge (hedging) is acting as a major factor is dominant.

(Positive opinion)

① Cointelegraph, a media specializing in cryptocurrency, said, “The low-priced purchases of institutional investors using price adjustment had a significant impact on rebounding Bitcoin, which had plunged below 44,000 dollars, to 57,000 dollars in 10 days.” On the 21st, it plummeted 25% from the all-time high of $58,352 to $43,700 on the 28th. After that, Bitcoin continued to rise and exceeded $57,000 on the day of the day, and it was found that during this period, major institutions such as Square continued to buy bitcoin.” Reported.

② Cryptocurrency media newsBTC analyst Yashu Gola said, “Bitcoin confirmed the MACD (Moving Average Convergence and Diffusion Index) Bull Cross this week. MACD Bull Cross is the potential price increase of assets. It is interpreted as a signal of,” he said, and said that the market analysis portal trading shot predicts that the BTC/USD pair price will rise to $65,000.

③ Mathew McDermott, head of Global Digital Assets at Goldman Sachs, said the demand from institutional investors for bitcoin and cryptocurrency is growing rapidly. “According to the Goldman Sachs survey, about a third of institutional investors currently own cryptocurrency,” he said. In addition, more than 50% of institutional investors said they plan to increase the proportion of digital assets in their portfolio in the next few months.” He added, “Loose monetary policy is driving the surge in institutional demand for digital assets.”

④ Crypto Briefing, a media specializing in cryptocurrency, said, “If Bitcoin, which has converted the decisive level of resistance to the level of support, remains above 50,000 dollars for the time being, it will be able to rise to 61,000 dollars as the buying pressure increases around the current price level.” Expected.

⑤ Cryptocurrency analyst Josh Rager said, “The positive correlation between the US’s massive stimulus package and the US stock market could help the bitcoin recover further.” After the breakthrough, it is expected to retest the all-time high of over 58,000 dollars.”

⑥ Cryptocurrency analyst Michael Van De Pope predicted, “It is important for Bitcoin to turn the 52,000 dollar resistance line into a support line,” he said. “If this happens, BTC will rise rapidly to the 56,000 dollar level.” “It is necessary to adjust the bitcoin price before the upward trend resumes,” he explained. “The current momentum slowdown is very natural.”

⑦ Bloomberg Intelligence’s chief strategist Mike McGlon said recently that investors are rapidly shifting their investments from gold to bitcoin as the preference for bitcoin as a store of value among investors has increased. He pointed out that while precious metals, which have existed for thousands of years, continue to remain as collectibles, Bitcoin is a hedge against inflation.

⑧Cointelegraph, a media specialized in cryptocurrency, cited Glassnode data and said, “The amount of bitcoins stored in the centralized exchange (CEX) has decreased by about 20% in 12 months.” According to the media, this is that investors are moving funds from exchanges to cold storage for long-term holdings of bitcoins, which could have a positive impact on bitcoin prices.

⑨ Cryptocurrency trader Peter Brant pointed out, “Many experts point out that bitcoin has risen excessively, but BTC will continue to rise in the future.” He said, “The reason for the increase in BTC price is that the depreciation of the US dollar has just begun,” and predicted that the dollar purchasing power will continue to decline in the future.

(Neutral opinion)

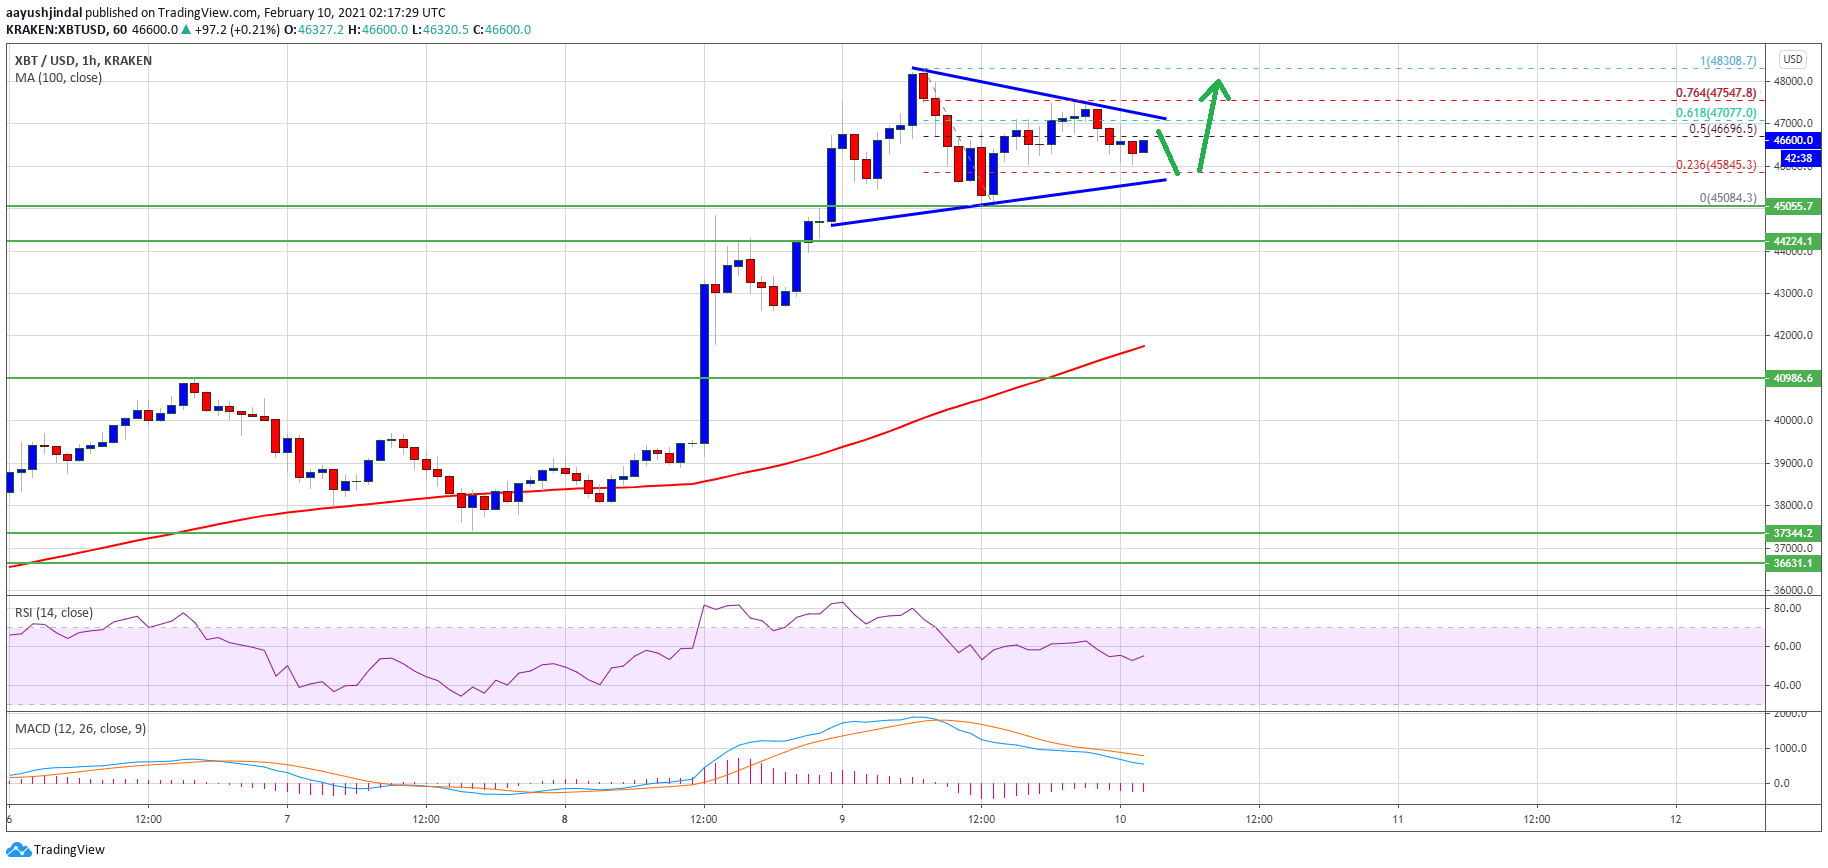
① Aayush Jindal, an analyst at Cryptocurrency NewsBTC, said, “If the BTC/USD pair price remains above USD 49,500 and USD 50,500, we can start a new rise, and if we exceed the USD 52,000 resistance level, we will start at USD 54,500. It can continue to be strong,” he predicted.

(Negative opinion)

① Shane I, who is in charge of product research and cryptocurrency derivatives development at Bybit, said that historically, looking at the cycle of bitcoin, March was not a good time for bitcoin. He expected to show a cautious attitude while leaning.

② Coinnis special analyst’JIn’s Crypto’ said, “On the 10th, it fell around USD 56,000 without overcoming short-term downside pressure. Although it is showing a rebound, it is difficult to see a surge in terms of a rise that does not accompany the trading volume.” At the moment when price volatility has decreased and price volatility has increased, a short-term downtrend may occur.”

◆Comprehensive Analysis of Bitcoin Market Price <Strengthening>

Bitcoin daily market price (see Figure 6) continues to be strong day after day. On the same day, there was an intraday adjustment trend due to an intraday decline in the U.S. CME bitcoin futures market price and the aftermath of the option maturity price, but the atmosphere is not significantly pushed by the continued buying trend.

Therefore, even if there is a slight adjustment, support is expected near the moving average of the 5th. Despite the recent increase, bitcoin trading volume, which showed a decreasing trend, has turned to an increasing trend, and the rise to the previous high seems okay. However, it is still unclear whether it will be possible to break through the top of the Bollinger Band, which is technically at the $58,000 level. (Refer to’Analysis of Bitcoin Transaction Volume on the Day’ on page 11)

Today is the expiration date of daily options for Bitcoin and Ethereum on the DRBT exchange. As a result of the simulation based on 14 o’clock, the expected settlement price for the two stocks was estimated to be around US$56,000 and US$1,820, respectively, as of 14:00. The price was adjusted upwards from the price of the $55,000 range, which was predicted at 10 am, and this is believed to be due to the strong intraday buying trend. However, it is also possible to confirm the backlash, and it seems that the actors have not been able to abandon their regret over the bearish turnover rather than the aggressive upward position change while changing positions. (Refer to the’Analysis of the Share of Bitcoin Option Open Agreements on the Day’ on page 15)

<Figure 6=BTC/USDT (Binance) Daily Price (Based on 14:00 on the 11th)/Chart=Trading View>

Binance BTC/USDT, calculated by the institute’s quant program, has an important price change for the day of $55,415. Bitcoin’s current market price is between the market price of the day and this price, so it is safe to try when the market price recovers the market price of the day. However, even if the market price recovers, it is not the same as the recent uptrend, or if the market price is not strong and shows weakness, it may fall to the 5th moving average and rise, so it is necessary to clear the volume and watch. For more detailed analysis based on market data, see ‘7. Please refer to the’Quantitative Analysis’ section.

<Figure 7=Deribit (DRBT) BTC Option Simulation Result of Expected Water Settlement Price on March 11 (at 14:00)/Data = Aim Rich Financial Engineering Research Institute>

◆Technical Analysis <Strengthening>

As of 14 o’clock on the 11th, the technical analysis of the daily price movement of bitcoin on Upbit, a domestic cryptocurrency exchange, and Binance, a foreign exchange, all showed’active buy’. Looking at the detailed evaluation items, Upbit came out with 7’Buy’, 0’Sell’ and 0’Neutral’ opinions, and’Strong Buy’ opinions among the oscillator indicators, and the moving average indicator was 12’Buy’ and It was summarized as a’buy’ opinion with zero’sell’.

<Figure 8=Upbit: BTC/KRW (Daily) Technical Analysis Summary Table/Data=Investing.com>

If you look at the detailed items of Binance, among the oscillator indicators,’Buy’ is 7,’Sell’ is 0, and’Neutral’ is 0, sending a’active buy’ signal, and the moving average indicator is’Buy’ is 12, ‘Sell’ was summarized as’Buy’ with zero.

<Figure 9=Binance: BTC/USDT (Daily) Technical Analysis Summary Table/Data=Investing.com>

◆Quantitative analysis

◇Crypto Fear & Greed Index <Strengthening>

The’Fear and Greed Index’ provided by the cryptocurrency data provider Alternative.me maintained the’Extreme Greed Level’ with 73 points, up 5 points from the previous day. This indicates that overheated investor sentiment continues. A value closer to 0 indicates extreme fear in the market, and a value closer to 100 indicates extreme optimism.

<Figure 10=Crypto Fear and Greed Index/Data=Alternative.Me>

◇Comparison of return by asset compared to the beginning of the year (%) (as of 14:00 on March 11) <Strengthening>

Despite external macroeconomic instability, the price of bitcoin continued to rise. As of 14 o’clock on the 11th, the US CME Bitcoin futures’ return to the beginning of the year soared 14.18% compared to last Tuesday, holding 79.46%, maintaining the No. 1 ranking among valuation assets. Second place was oil futures with a 35.85% return, but fell 0.75% over the same period.

The demand for a $38 billion 10-year Treasury bond bid, held the afternoon of the previous day, received positive reviews from the market, easing concerns that US debt growth would put too much pressure on the Treasury market and boost Treasury yields. International oil prices rose in anticipation of a recovery in demand despite a large increase in US crude oil stocks.

The increase in crude oil stocks is attributed to the damage to refinery facilities following a record cold wave. Nevertheless, expectations for a rapid economic recovery are maintained, with the US House of Representatives passing a $1.9 trillion stimulus package. It is analyzed that the expectation that large-scale stimulus measures will revitalize the demand for crude oil has led to a rise in prices. Meanwhile, since last Tuesday, the dollar index and gold futures fell 0.55% and 2.25%, respectively, while the S&P 500 index rose 2.09%.

<Table 2=Status of increase/decrease in return by asset category/data=Chicago Commercial Exchange, USA>
<Figure 11=Year-to-Year-Year Trends by Asset Category/Data=Trading View>

◇Comparison of yield by cryptocurrency compared to the beginning of the year (%) (as of 14:00 on March 11) <Strengthening>

Although the price of bitcoin has skyrocketed, the rate of growth for most cryptocurrencies is still limited. Among the top 5 stocks by market capitalization, the rate of increase was only similar to that of Bitcoin, except for the surge in Binance Coin (BNB) since last Tuesday, and Uniswap (UNI) and Chainlink (LINK) declined. As of 14:00 on the 11th, Binance Coin (BNB) ranked first with 638.78%, Cardano (ADA) second with 543.65%, Uniswap (UNI) third with 530.77%, and Polkadot (DOT) with 347.21% With 145.29% in fourth place and LINK in fifth place.

<Figure 12=Ranking of the top 10 cryptocurrencies in market capitalization compared to the beginning of the year/Data=Trading View>

◇Bitcoin on-chain indicator analysis

① Analysis of Bitcoin transaction volume on the day <Strengthening>

Analyzing the trading volume of BTC/USD’s on-chain data on the same day makes it easy to check the direction of the bitcoin market and respond to it. Indicator 1 in Figure 13 shows the spot trading volume of BTCUSD, BTCUSD or BTCUSDC on 10 major exchanges (Binance, Bitfinex, PoloniX, Bitex, Coinbase, Bitstamp, Kraken, HitbittyC, Gemini), Indicator 2 shows the trading volume of BTCUSD or XBTUSD indefinite futures on 7 derivatives exchanges (Binance Futures, OKX Futures, OKX Futures, Huobi Futures, FTX Futures, Kraken Futures, Delibit, BitMEX) in real time. Sum up and display.

<Figure 13=Comparison of total BTC spot trading volume and total BTC derivatives trading volume on major exchanges/Data=Aim Rich Financial Engineering Research Institute>

Looking at Index 1 in Figure 13, it can be seen that the bitcoin spot trading volume of major exchanges, which had been declining, is increasing in earnest. This translates to meaning that investors are beginning to be convinced about the uptrend. The increase in futures trading volume in Figure 13-2 means that volatility has increased during the ascent process. Unlike the smoothness in the previous uptrend, short-term trading opportunities also increase because selling forces aiming for short-term gains emerge. If you don’t, you should be careful as the loss may increase.

<Figure 14=Comparison of daily BTC purchases and total sales of major exchanges/Data=Aim Rich Financial Engineering Research Institute>

Looking at the indicators in Figure 14, the difference between the total number of purchases and the total number of sales is not clear, but the number of purchases is rather large. During the intraday, there may be changes depending on the market change, but price volatility is progressing to the highest point in the upward direction, so there is a high possibility that it will close on the day. Today is the expiration date of daily Bitcoin and Ethereum options on the DRBT exchange, and the expected settlement price for both stocks is estimated at $55,400 and $1,780, respectively, as of 14:00.

② Bitcoin price and Korea premium index trend analysis <strong>

Although the Kimchi premium index is still above ‘0’, the gap between Bitcoin and Ethereum has widened considerably as the price of bitcoin and Ethereum has risen, so we don’t think it will simply turn into a downtrend. Of course, you should be wary of short-term surges, but you should be wary of a sharp decline, but now that only bitcoin has erupted the market price, it is expected that good results will be obtained if you respond to the bottom of each stock in case of a decline.

<Figure 15=Bitcoin Price and Bitcoin Kimchi Premium Index Trend Comparison/Data=CryptoQuant>
<Figure 16=Comparison of Ethereum Price and Bitcoin Kimchi Premium Index Trends/Data=CryptoQuant>

③ Analysis of mass transaction volume according to on-chain indicators after bitcoin plunge <Strengthening>

Figure 17 shows the trend of the Bitcoin balance held by major exchanges. As the recent bitcoin plunged after the all-time high, the bitcoin balance, which has increased a lot, has declined significantly now when the market price surged. Therefore, an additional rise in the bitcoin market is expected.

<Figure 17=Bitcoin market price and comparison of Bitcoin balances held by major exchanges/Data=Cryptoquant>

◇Analysis of the share of non-settled bitcoin options on the day <weak>

As a result of analyzing the percentage of outstanding contracts aggregated from bitcoin options issued by major cryptocurrency exchanges (Deribit, OKEx, Bit.com) (see Figure 18), the rising position was 14 at 10 o’clock, which was 4.00% based on the number of contracts. At the time, it was changed to a 41.87% decline. In terms of premium, it is expected that intraday decline is expected as the intraday decline is expected as it will change from 19.80% (buy call option): 15.91% (buy put option) to 11.25% (sell call option): 3.34% (buy put option) at 10 o’clock. see.

<Figure 18=Analysis of non-payment agreements for bitcoin options at major exchanges as of 10 o’clock (upper) and 14:00 (lower) on the 11th = Data/Data = Aim Rich Financial Engineering Research Institute>

In the same way, as a result of analyzing the percentage of pending contracts aggregated from bitcoin options issued by the DRBT exchange (see Figure 19), the downside position, which was 26.90% at 10 o’clock in terms of the number of contracts, was 35.71% at 14 o’clock. In terms of premium standards, it has been changed from -19.80% (sell call option):-5.38% (sell put option) to -18.46% (sell call option):9.82% (buy put option) at 10 o’clock. It can be seen that the composite position has also strengthened in the sell direction three hours ahead of the market.

<Figure 19=Analysis of non-payment agreements for bitcoin options of Deribit Exchange as of 10 o’clock (top) and 14 o’clock (bottom) on the 11th> Data/Data = Aimrich Financial Engineering Research Institute>

contact@blockcast.cc

Categories
News

Bitcoin market insights: miners’ sell-off slows down, exchange balances continue to fall (www.blockcast.cc)

Taking into account the rapid increase in U.S. bond yields, the elasticity of Bitcoin’s price trends compared with macro assets such as gold and stocks is still significant.

Original title: “Glassnode 丨Data on the chain shows that $47000 has become a strong support level for BTC? 》
Written by: CHECKMATE
Translation: Li Hanbo

This week, the volatility of the Bitcoin market has decreased as it consolidates between a price high of $52,420 and a low of $46,561. What is impressive is that despite the weakness in both the stock and precious metal markets, the Bitcoin consolidation still held the 45k USD support level identified by Willy Woo in last week’s newsletter .

The strengthening of the US 10-year Treasury bond yield continued to strain the market. The yield rebounded by 10.7%, and this week closed at a 52-week high of 1.566%. The stock market’s performance was weak. The S&P 500 Index and the Nasdaq 100 Index fell 5% and 8%, respectively, and gold fell to a 38-week low of $1,730.

Putting Bitcoin alongside these macro assets, considering the significance of such a rapid revaluation of Treasury bond yields, the elasticity of its price movements is very significant.

Bitcoin market insights: miners' sell-off slows down, exchange balances continue to fall

Support on the chain

Last week Willy Woo pointed out that there are a large number of BTC trading on the chain around 45,000 USD, forming an on-chain support level . At the end of this week, @n3ocortex emphasized that this support level has actually been strengthened to over US$46,600, and 1.2 million BTC (accounting for 6.5% of the circulating supply) have been traded in this area.

When a large number of currencies move on the chain and the support level on the chain remains unchanged, this indicates that there is a lot of interest in hoarding coins, and buyers see it as a “value” entry point. Remember, although the chain support level has gradually strengthened since last week, if the price breaks below, it will become an equally strong resistance level.

Bitcoin market insights: miners' selling slowed down, exchange balances continued to fall

Bitcoin market insights: miners' sell-off slows down, exchange balances continue to fall

In fact, if we look at the price distribution of UTXO, the on-chain support level of $47,173 is the largest since the price of $11,000. In addition, the active block on the chain shown in green in the figure below is not just a specific reserve price, but a large support area. We can see that there is a continuous and significant trading volume between 45.5k USD and 48.9k USD. This range now represents one of the largest accumulation levels of BTC on the chain in history-the largest since the last cycle’s $20,000 ATH was broken.

Bitcoin market insights: miners' sell-off slows down, exchange balances continue to fallURPD real-time chart

An important question we have to ask is whether this kind of on-chain transaction volume is related to hoarding coins, or is it the seller’s eagerness to withdraw. In the first step, we can observe that the BTC balance of the exchange continues to go down without interruption , and another 35,200 BTC withdrew this week.

Bitcoin market insights: miners' sell-off slows down, exchange balances continue to fallReal-time graph of exchange rate balance

Miner holdings

Miners are extremely optimistic participants of the Bitcoin network, but they have made huge CAPEX (capital expenditure) and OPEX (operating costs) investments in ASIC hardware and facilities. In other words, they are still sellers of BTC to pay for ongoing capital and operating costs .

If we investigate the balance of known miners, we can see that until the beginning of January 2021, miners’ holdings are increasing . Before 2021, the balance of miners will decrease, but the scale of the reduction is not comparable to the previous increase.

Please note that the miners shown below are only those we have identified (shown to provide a good visualization of this trend). There is also a large number of unknown miners (“other”), they represent an important part of the mining market, we will investigate them in the next picture.

Bitcoin market insights: miners' selling slowed down, exchange balances continued to fallMiner Balances Live Chart

The miner’s position change indicator takes into account all the balances of all newly issued currencies, thus providing us with a global mining landscape. What we have observed is the peak of selling behavior throughout January (17,000 to 24,000 BTC/day), which can be largely attributed to some larger unknown miners (and even some early miners in 2010!) .

However, throughout February, we can see that the miners’ selling speed is decreasing, and nowadays, the bulls and bears are biased towards neutral. Although the newly issued coins account for only a small portion of the daily transaction volume (that is, the portion sold by the miners is small), it seems that even the miners are returning to a neutral or hoarding model .

Bitcoin market insights: miners' sell-off slows down, exchange balances continue to fallMiner Net Position Change Live Chart

Long-term position holders

Long-term holders (LTH) are classified as those who hold coins for more than 155 days, or those who withdraw to cold wallets.

In on-chain analysis, we must make assumptions around the behavior and incentive mechanisms of various network entities. For LTHs, we generally make an assumption that they have a good knowledge of Bitcoin and have high beliefs. Therefore, their coins tend to hoard coins in a bear market, stay in a dormant state for a long time, and regain a new life with their selling strength in a bull market trend.

The supply-adjusted CDD indicator is good at tracking this type of LTH behavior. The longer a Bitcoin is dormant, the more “coin days” it can store. As more old coins are spent and more coin days are destroyed, the CDD indicator will show an upward trend .

Bitcoin market insights: miners' sell-off slows down, exchange balances continue to fallCDD real-time graph after supply adjustment

The above figure shows that from October 2020 to January 8, 2021, LTHs did indeed begin to sell (CDD is on an upward trend). However, since January 8th, LTHs have slowed down this behavior. The 7-day and 30-day moving averages of CDD have both returned to high levels, but it is not uncommon for the early bull market or even a bear market. This indicator shows that, similar to miners, LTLHs are also making profits, but they are certainly not in a hurry to flee .

To further increase the weight of this argument, we can look at the net balance of these LTHs. We see a pattern that is almost the same as that of miners, that is, from the end of 2020 to the beginning of January 2021, there was a peak of selling, and then a sharp slowdown. In terms of net value, LTHs are still distributed at a rate of approximately 44,500 BTC per day, but this only accounts for less than 5% of the daily trading volume of the futures market, and the trend is to reduce expenditures.

Bitcoin market insights: miners' sell-off slows down, exchange balances continue to fallReal-time graph of net position changes

The situation of short-term position holders

Finally, we will study the behavior of short-term holders (STH) who hold coins for a relatively short period of time (<155 days). STHs usually account for most of the daily traffic on the chain. In on-chain analysis, we usually assume that STHs are short-lived users, speculators, and day traders who are more sensitive to price fluctuations .

First, let’s review the relative supply held by STH wallets, which are profitable (the coins that have been held for a short period of time are finally moved at a cheaper price, green) and the wallets that are now in a loss state (red). During the rebound to the current ATH of $58,300, more than 5.12 million STH holdings of BTC were profitable.

When this correction sold to a low of $ 43,300, more than 1.14 million of these BTCs became losses, and another 10,200 BTC was bought at the beginning of the correction (and then fell into a loss) .

This shows that in the past two weeks, about 112,000 coins have been transferred from LTH to STH, and above $45,000, STH has accumulated 1.25 million BTC (this is also in line with the tweet by @n3ocortex and our in this article The URPD at the beginning of the article is the same).

Bitcoin market insights: miners' sell-off slows down, exchange balances continue to fallSTH profit and loss supply real-time graph

We can increase the weight of these profit and loss dynamics by observing the STHs expenditure output profit rate. This indicator looks at how much profit all UTXOs classified as STH achieved during the day’s sell-off.

  • SOPR> 1.0 means that the day is profitable

  • SOPR = 1.0 means that no profit or loss was realized on the whole day.

  • SOPR<1.0 means that if you sell on that day, you will lose money.

Last week, we saw SOPR reset below 1.0. We theoretically believe that this is the first indicator of new retail investor losses . This week we saw SOPR-STH pull back above 1.0, despite the sideways price consolidation.

This second SOPR reset is healthy because it represents the belief in STH’s bargaining. In the past, the retest of SOPR after falling below 1.0 generally marked the cessation of the downward correction, and in this bull market cycle, the price upward momentum has also followed .

Bitcoin market insights: miners' selling slowed down, exchange balances continued to fallSTH SOPR Live Chart

Weekly Bitcoin market summary

The above on-chain analysis is a typical workflow that we use to evaluate the emotions and behaviors of different network participants under a set of behavioral assumptions. In order to maximize the value of insights on the chain, we must seek a convergence between multiple indicators to improve our accuracy and probability of correctness.

This week, we have:

  • Despite the turbulence of the macro market and the weakness of the traditional market, Bitcoin is still consolidating sideways above the strong on-chain support level (maintained last week).

* The on-chain support of USD 45k has actually strengthened the exchange of more than 1.2 million BTC, and even raised the bottom line of support to the range of USD 46.6k to USD 47k**.

  • After several months of selling, the miners slowed down their selling behavior. Compared to BTC’s daily trading volume and miners’ hoarding of coins before 2020, this selling volume is very small .

  • Long-term holders slowed down the sell-off after the sell-off that started in 2021. Many of our longevity indicators (such as CDD and ASOL) have dropped significantly (meaning fewer old coins moved), and the selling speed of LTH balances has also decreased .

  • Short-term holders (assuming new investors/speculators) have already suffered losses last week and bought the lower limit. This week their belief in lower limit buying has been put to the test. More coins were transferred from LTH to STH. However, we did not see another SOPR below 1.0, indicating that we did not get more panic selling .

The data on the chain shows that Bitcoin’s bull market this week is relatively strong. The main risk one must bear in mind is that the key chain support level between $45,000 and $47,000 falls, and many of our observations may change from a strong support level to a heavy resistance level.

Let’s block ads! (Why?)

Categories
News

Ripple CEO: XRP will continue trading, even if Ripple ceases to exist (www.blockcast.cc)

Ripple CEO Brad Garlinghouse has once again addressed the SEC lawsuit against his company. In a recent interview, Garlinghouse countered the allegations and said that the legal action was “misguided” and that its crypto asset has traded for eight years in the US before regulators filed the lawsuit last December. 

Recently, the Commission chose to file a motion to dismiss a petition filed by XRP investors who sought to amend SEC’s complaint against Ripple. In their response, SEC claimed that the investors cannot prove that crypto exchanges – that earlier delisted XRP – “will reverse course, or that the value of XRP will increase, should the Commission amend its complaint.”

However, regardless of the outcome of the legal battle, Garlinghouse appears to be positive about the future of XRP, at least outside the USA. He said:

If you own a security, it gives you ownership of a company. If Ripple goes away, XRP will continue trading.

The Ripple chief mentioned that other countries such as Switzerland, Japan, and Singapore apparently have “clarity and certainty” with regard to the status of XRP. 

Meanwhile, crypto exchanges in US began delisting XRP, as some believed that the asset posed certain risks. Recently, Kraken’s CEO Jesse Powell said the crypto is a “huge asymmetrical risk for exchanges” and added: 

Recently, Garlinghouse told Reuters that the SEC lawsuit has hindered the company’s activity in US, but “it has not really impacted” the firm’s growth in the Asia Pacific. Stating that he was unaware of any exchanges based out of US that halted XRP he claimed: 

We’re seeing the activity of XRP liquidity has grown outside the United States and continue to grow in Asia, certainly in Japan,

XRP is traded on over 200 exchanges around the world. It’s really only three or four exchanges in the United States that have halted trading,


Sign Up For Our Newsletter


Let’s block ads! (Why?)

Categories
News

[Photo News] Bitcoin breaks through resistance line ‘will it continue to rise again’ (www.blockcast.cc)

Cryptocurrency (virtual currency) Bitcoin price is displayed on the electronic board of Bithumb, a cryptocurrency (virtual currency) exchange in Gangnam-gu, Seoul on the afternoon of the 4th, when Bitcoin broke the $50,000, which was considered a major resistance line.

Categories
News

TA: Ethereum Sets New ATH, Why ETH Could Continue Higher To $1,950 (www.blockcast.cc)

Ethereum extended its rise and traded to a new all-time high at $1,830 against the US Dollar. ETH price is trading in a positive zone and it looks set for more gains towards $1,900.

  • Ethereum corrected lower, but it regained strength to set a new all-time high near $1,830.
  • The price is now trading well above $1,750 and the 100 hourly simple moving average.
  • There is a major ascending channel forming with support near $1,760 on the hourly chart of ETH/USD (data feed via Kraken).
  • The pair could dip in the short-term, but the bulls are likely to aim more gains above $1,850.

Ethereum Price Remains Elevated

After spiking above the $1,800 level, Ethereum started a short-term downside correction (similar to bitcoin). ETH corrected below $1,760, but it remained stable above $1,720.

As a result, there was a fresh increase above the $1,800 level. Ether price even traded to a new all-time high near $1,830 and settled well above the 100 hourly simple moving average. It is now showing positive signs above the $1,800 level.

An initial support is near the $1,790 level. It is close to the 50% Fib retracement level of the recent wave from the $1,755 swing low to $1,830 high. There is also a major ascending channel forming with support near $1,760 on the hourly chart of ETH/USD.

Ethereum Price

Ethereum Price

Source: ETHUSD on TradingView.com

An intermediate support is near the $1,770 level. It coincides with the 76.4% Fib retracement level of the recent wave from the $1,755 swing low to $1,830 high.

On the upside, the price is facing resistance near the $1,830 and $1,850 levels. A proper break above $1,850 might start a steady increase above $1,880. In the stated case, the price may even break the $1,900 level and continue higher towards the $1,950 level.

Dips Supported in ETH?

If Ethereum fails to clear the $1,830 and $1,850 resistance levels, it could correct lower. On the downside, the first major support is near the $1,770 level.

The next major support is near the channel support at $1,760. Any more losses may possibly lead the price towards the $1,700 level and the 100 hourly simple moving average.

Technical Indicators

Hourly MACDThe MACD for ETH/USD is slowly gaining momentum in the bullish zone.

Hourly RSIThe RSI for ETH/USD is still well above the 50 level.

Major Support Level – $1,760

Major Resistance Level – $1,850

Let’s block ads! (Why?)

Categories
News

TA: Bitcoin Consolidates Above $46K, Why BTC Could Continue Higher (www.blockcast.cc)

Bitcoin price started a downside correction after trading to a new all-time high near $48,308 against the US Dollar. BTC is now consolidating gains and it is likely to continue higher above $47,000.

  • Bitcoin traded to a new all-time high at $48,308 before correcting lower.
  • The price is now well above $45,500 and the 100 hourly simple moving average.
  • There is a new contracting triangle pattern forming with resistance near $47,050 on the hourly chart of the BTC/USD pair (data feed from Kraken).
  • The pair is likely to continue higher once it clears the $47,000 and $47,100 levels.

Bitcoin Price Remains Supported

There was a nasty increase in bitcoin price above the $45,000 resistance level. BTC even broke the $47,000 level and traded to a new all-time high at $48,308.

Recently, there was a downside correction below the $47,000 level. The price even traded below the $46,000 level, but it remained stable above $45,000. A low was formed near $45,084 before the price recovered higher.

It is now well above $45,500 and the 100 hourly simple moving average. There was a break above the 50% Fib retracement level recent decline from the $48,308 high to $45,084 low. There is also a new contracting triangle pattern forming with resistance near $47,050 on the hourly chart of the BTC/USD pair.

Bitcoin Price

Bitcoin Price

Source: BTCUSD on TradingView.com

The triangle resistance is close to the 61.8% Fib retracement level recent decline from the $48,308 high to $45,084 low. If there is a clear break above the triangle resistance, there are chances of a steady increase above $47,500. The next major resistance is near the $48,000 level. Any more gains could open the doors for a push towards the $50,000 level.

Dips Supported in BTC?

If bitcoin fails to continue higher, it could correct lower towards the $46,000 level. The next major support is near the $45,800 level and the triangle lower trend line.

A downside break below the triangle support could push the price towards the $48,000 support level. Any more losses below the $45,000 may possibly lead the price towards the $43,200 support level in the near term.

Technical indicators:

Hourly MACD – The MACD is slowly losing momentum in the bearish zone.

Hourly RSI (Relative Strength Index) – The RSI for BTC/USD is still well above the 50 level.

Major Support Levels – $45,800, followed by $45,000.

Major Resistance Levels – $47,000, $47,100 and $48,000.

Let’s block ads! (Why?)

Categories
News

[Aim Rich Investment Strategy] Will Bitcoin continue to weaken in the short term… Concerns about weakening price momentum (www.blockcast.cc)

Aim Rich Cryptocurrency Investment Information (2021.1.21)
<Figure 1=Market trend score as of 14:00 on the 21st (based on 100 points, left)/Market rise/fall intensity (right)/Data=Aim Rich Financial Engineering Research Institute>

◆Cryptocurrency market conditions <weak>

Bitcoin price, which started to decline right after opening, has once dropped $34,000 during the day, but is rebounding again. As the transaction volume of bitcoin decreases, the momentum of price increase is weakening. In particular, as it becomes uncertain whether the bitcoin price can recover to the $40,000 level, it is struggling to maintain the $35,000 support level. Some point out that if the rebound momentum is not found, it could be threatened with a lead of $30,000.

Major altcoins also fell sharply, and Ethereum (ETH), the second-largest cryptocurrency in the market cap as of 14:00 on the 21st, fell to $1278.99 at a time on the cryptocurrency exchange Binance, then fell to $1,310.50 (-4.82%) and market capitalization. The fourth place Polka Dot (DOT) was trading at $16.8174, down 9.45%. However, Ripple, the fifth place in the market cap, is trading at $0.2971, up 0.65%.

As of 14:00 on the 21st, the price of Bitcoin based on CoinMarket Cap is $36,585.81, the 24-hour trading volume is about 66.2 billion dollars, and the market cap is about 6442 billion dollars. The total cryptocurrency market cap is $829.7 billion, and the Bitcoin market cap share is 64.8%.

The total cryptocurrency market capitalization decreased by 3.01% compared to the previous day, and the market cap excluding bitcoin decreased by 3.77% compared to the previous day, making Bitcoin stronger than Altcoin, and bitcoin’s market cap decreased 2.62% compared to the previous day. The market share of the company increased by 0.41% compared to the previous day, indicating that the number of coins in the market as a whole is falling further than the bitcoin price.

<Figure 2=Status of Real-Time Cryptocurrency Market/Data=Aim Rich Financial Engineering Research Institute>

On the other hand, according to the Weiss Crypto Index, the market, which started to decline right after opening, is trying to rebound after forming a trough around 15:00. It was analyzed that the decline of small stocks in particular was large. W50, a cryptocurrency market index including bitcoin, is -2.63%, W50X, a cryptocurrency market index excluding bitcoin, is 3.13%, WLC, a large stock-oriented index, is -2.50%, and WMC, a medium-sized stock-oriented index- 2.97% WSC, an index centered on small stocks, recorded -4.23%.

<Figure 3=Longs/Shorts cumulative trading volume ratio of major exchanges in the past 24 hours/Data=Aim Rich Financial Engineering Research Institute>
<Table 1=Ratio of Longs/Shorts trading volume of major exchanges as of 14:00 on the 21st/Data=Aim Rich Financial Engineering Research Institute>

As of 14 o’clock on the 21st, the ratio of buy:sell cumulative transaction volume for the past 24 hours was 48%:52%, and the sell ratio was high, and as of 14 o’clock, the selling rate was strong in the long/short ratio of each exchange.

At the same time, on the cryptocurrency derivatives exchange BitMEX, the basis of bitcoin futures is around +6.5, and the basis of Ethereum futures is around +1.2. The price of bitcoin futures on the Chicago Merchandise Exchange (CME) is falling. January futures traded at $34,635.0, up $295.0 (-0.84%) compared to the previous day.

◆Main cryptocurrency prices <weak>

As of 14:00 on the 21st, the domestic bitcoin (BTC) price fell 2.11% from the previous day to 3,8492,000 won, Ethereum (ETH) fell 5,28% to 1.453,000 won, and Ripple (XRP) rose 0.31% to 328. Hit the circle. Bitcoin Cash (BCH) fell 3.29% to 534,000 won, Bitcoin SV (BSV) fell 3.55% to 214,350 won, EOS (EOS) fell 0.65% to 3,050 won, and Chainlink (LINK) was compared to the previous day. It is trading at 23,570 won, down 2.40%, Ada (ADA) down 2.17%, 406 won, and Litecoin (LTC) down 3.50% to 16,150 won.

<Figure 4=Upbit BTC/KRW Daily Chart/Data=Trading View>
<Figure 5=Top 10 Coin Price (As of January 21, 14:00)/Image=Coin Market Cap>

At the same time, the global cryptocurrency market price based on CoinMarket Cap is falling among the top 10 stocks by market capitalization as of the last 24 hours, excluding Tether. The international Bitcoin (BTC) price is $34,587.96, down 2.17% from the same time the day before. Ethereum (ETH) fell 4.00% to $1,310.04, while Polkadot (DOT) rose 5.85% to $16.82. Ripple (XRP) rose 0.44% to $0.2979, Cardano (ADA) rose 1.54% to $0.3644, Litecoin (LTC) fell 5.20% to $143.36, Bitcoin Cash (BCH) fell 4.35% to $480.89, Chainlink (LINK) fell 3.25% to $21.18, while Binance Coin (BNB) fell 0.68% to $41.62.

◆ Analysis of major media and market experts <neutral>

Many experts predict that the resolution of the $38,000 and $40,000 resistance levels beyond the valuation burden and continuing sell-offs will be the inflection point for the Bitcoin rally. In this process, the constant inflow of institutional buying tax is key. In addition, they expect that bitcoin trading volume will not increase much in the short term. However, some analysts pointed out that while the volatility of bitcoin is gradually increasing, unlike in the past, the volatility of bitcoin is eventually leading to an upward trend.

(Positive opinion)

① Cryptocurrency investor Dan Tapiero explained that the current volatility of bitcoin suggests that the uptrend of bitcoin is only beginning. As the current price is close to the lowest of the long-term fluctuation range, it is best to keep it.

② Lawrence Summers, a Harvard University professor who served as the US Treasury Secretary, predicted in an interview with Bloomberg TV that “the Bitcoin ecosystem will not collapse and will continue to survive.” When asked media questions about whether Bitcoin is a bubble, he said, “I’m not going to talk about Bitcoin’s volatility in the next six months. But some institutions love Bitcoin. I don’t think all of this will collapse. Price fluctuations are bits.” “It makes the coin look more resilient, and it makes people move. People also take into account the finiteness of the bitcoin supply, which in turn causes the price to rise.”

(Neutral opinion)

① Cryptocurrency analyst filbfilb diagnosed, “Bitcoin price could be trapped in consolidation (flooding) between $30,000 and $38,000.” However, he said, “The whale alert, which tracks the movement of bitcoin whales, started a massive influx of bitcoin whale addresses at $29,314. This will be the level of support for bitcoin in the short and long term.” While the volatility of bitcoin is gradually increasing, unlike in the past, the volatility of bitcoin will eventually lead to an upward trend.”

(Negative opinion)

① As a result of a survey conducted by Deutsche Bank, a global investment bank, for global fund managers, more than half of them expected a decline in the price of Bitcoin. According to the media, they predicted that “the bubble of digital assets including Bitcoin and some technology stocks such as Tesla is serious,” and “the price will drop by more than 50% in the next 12 months.”

② Coinnis special analyst’JIn’s Crypto’ diagnosed, “Bitcoin trading activity is low and volatility is not large at this time. Investors’ transaction costs during the adjustment period are on the rise, so it is not very helpful for price stability.” He continued, “The number of large transactions over 100BTC reached 1,077, hitting a short-term high. Big players are still trading frequently. Accordingly, there is a possibility that Bitcoin will be out of the current price range. In the future, at the bottom of $38,000, It is necessary to pay attention to the movement of the person.”

③ John Trading’s chief market strategist Michael O’Rourke warned, “It could be a risk signal to investors for a company to buy financial assets for speculation purposes, regardless of its core business.”

④ Steve Forbes, the founder of the global media outlet’Forbes’, said, “BTC is receiving reflective profits due to distrust of traditional currencies. Global financial institutions’ further movement of BTC investment portfolio is also accelerating.” However, he said, “However, bitcoin is not a currency. It is not stable. It was a high-end’steak’ today, and it can be turned into’dog food’ tomorrow. A limited supply can also meet the growing economy and market demand. It is questionable whether there will be,” he explained.

◆Comprehensive Analysis of Bitcoin Market Price <Weakness>

Bitcoin’s daily market price (see Figure 5), which technically began to drop from the 5th moving average line to resistance shortly after the opening, was intensified as the intraday US CME Bitcoin futures coincided with the downward trend filling the gap on the day. The buying trend that had flowed in during the rising period disappeared, and the price that had initially converged fell below the moving average line on the 20th, and the center of gravity shifted to a decline, so the bitcoin price gradually turned to a short-term weakness even if it did not drop sharply immediately. Is expected to be.

According to the market analysis data of the Institute, 1) the daily technical indicator is actively buying, 2) the market participants’ investment sentiment is very good, based on the crypto fear and greed index, and 3) the kimchi premium index is stable’buy’ Maintaining the level 4) Same-day payment options The high proportion of call options due to the number of outstanding payment options is a positive factor.

<Figure 6=BTC/USDT (Binance) Daily Price (Based on 14:00 on the 21st)/Chart=Trading View>

However, 1) Bitcoin’s return is gradually decreasing compared to the beginning of the year, 2) On-chain transaction indicators, it is highly likely that the bitcoin price on the same day will close with a volatile movement around $36,000, 3) Close maturity As a result of the analysis of the bitcoin option pending contract, it is expected that the volatility with a considerable amplitude is expected to be significantly greater over time based on $36,000 to 37,000 dollars.

According to the R&D’s market analysis data, it is positive that 1) the kimchi premium index maintains a stable’buy’ level, and 2) the high proportion of call options due to the number of outstanding payment options on the day.

However, 1) the daily technical indicator has turned to’neutral’, 2) the investor sentiment of market participants, seen as a cryptocurrency and greed index, fell below 80 points for the first time since the beginning of November last year, and 3) Bitcoin compared to the beginning of the year There are more negative factors, such as the fact that the rate of return of is gradually lowering, and 4) there is a high possibility of a weakening of the bitcoin price on the day of the on-chain transaction index.

In addition, as a result of the simulation using the bitcoin option data of the near expiration date by the institute, it is predicted that the bitcoin price will move from 35,000 to 36,000 dollars and then decrease to the level of 28,000 dollars as well as increase in price volatility toward the end of the month. It is judged to be necessary.

On the other hand, the intraday variable today is the settlement date of the Bitcoin and Ethereum options on January 21 of the DRBT exchange. Options due today have a lower strike price and less pending contracts than other maturity dates, so the impact on the market is expected to be somewhat less, but as a result of analyzing the proportion of all open contracts of Bitcoin options by Delibit (DBT) by time ( See Figure 16), as the proportion of call option sales accounted for 2/3, the seller’s involvement seems to have been severe.

However, since the estimated price of the Delibit Bitcoin option payment (see Figure 17), which is due on the same day as simulated at 14:00, is expected to be around $35,000, there is a possibility that it will rebound to at least $35,000 around 5 pm after confirming the low. It is high, so please refer to this point and check the rebound flow of other coins.

Binance BTC/USDT, calculated by the institute’s quant program, has an important price change on the day of $35,094 (pink line), and the current price is below this, so the price 1) breaks from the previous day’s low and recovers , 2) If it rebounds with the bottom of the pair without breaking from the previous day’s low price, and 2) it can buy if it recovers to $35,094.

However, if it declines while maintaining its weakness, it is necessary to check whether the low price was broken the previous day. For more detailed analysis based on market data, see ‘7. Please refer to the’Quantitative Analysis’ section.

◆Technical analysis <neutral>

As of 14 o’clock on the 21st, the technical analysis of the daily price movement of Bitcoin on Upbit, a domestic cryptocurrency exchange, and Binance, a foreign exchange, were all found to be’neutral’. Looking at the detailed evaluation items, 2 of the oscillator indicators of Upbit came out of’Buy’, 5’Sell’, and 1’Neutral’ opinion and’Strong Buy’ opinion, and the moving average indicator is’Buy’ and 7 It was summarized as a’buy’ opinion with five’sell’.

<Figure 7=Upbit: BTC/KRW (Daily) Technical Analysis Summary Table/Data=Investing.com>

If you look at the detailed items of Binance, two of the oscillator indicators are’Buy’, 5’Sell’, and 1’Neutral’, sending a’Sell’ signal, and the moving average indicator is’Buy’ with 7 and’Sell’. ‘Sell’ was summarized as’Buy’ with five.

<Figure 8=Binance: BTC/USDT (Daily) Technical Analysis Summary Table/Data=Investing.com>

◆Quantitative analysis

◇Crypto Fear & Greed Index <Weakness>

The’Fear and Greed Index’ provided by the cryptocurrency data provider Alternative.me is 75 points, down 3 points from the previous day, and has been down one step from the extreme greed stage of the previous day to the greed stage. Since then, it recorded the lowest level, indicating that investment sentiment has deteriorated. The index closer to 0 indicates extreme fear in the market, and closer to 100 indicates extreme optimism.

<Figure 9=Crypto Fear and Greed Index (Top) and Daily Trend (Bottom)/Data = Alternative.Me>

◇Comparison of return by asset compared to the beginning of the year (%) (as of 14:00 on January 21) <weak>

Despite the decline in the dollar index over the past two days, the US CME’s Bitcoin futures’ yield compared to the beginning of the year was 11.05%, down 1.87% from the previous Tuesday, while oil futures, which had been on the rise since the beginning of the year, rose 1.13%. It has exceeded the rate of return of the coin.

The previous day, the US stock market ended higher with President Biden taking office. Both the NASDAQ and the S&P 500 recorded all-time highs. As government bond yields fall, the government’s stimulus and low interest rates are expected to remain for some time. It is positive that the number of new coronavirus cases in the United States has decreased to less than 200,000. Meanwhile, gold and oil prices ended higher on the previous day due to a weak dollar and expectations of stimulus measures.

<Table 2=Status of increase/decrease in return by asset category/Data=Chicago Commercial Exchange, USA>
<Figure 10=Year Earnings Trend by Asset Category/Data=Trading View>

◇Comparison of yield by cryptocurrency compared to the beginning of the year (%) (As of January 21, 14:00) <Weakness>

As the cryptocurrency market enters the adjustment period, the overall rate of return is lowering compared to the beginning of the year. As of 14:00 on the 21st, Stellar (XLM) ranked 1st with 118.79% at the beginning of the year as of 14:00 on the 21st, Cardano (ADA) ranked 2nd with 110.57%, and Polkadot (DOT) ranked 3rd with 108.29%. Ethereum (ETH) ranked 4th with 81.90% and Chainlink (LINK) 5th with 81.42%.

<Figure 11=Ranking of the top 10 cryptocurrencies by market cap compared to the beginning of the year/Data=Trading View>

◇Bitcoin on-chain indicator analysis

① Analysis of Bitcoin transaction volume on the day <weak>

Analyzing the trading volume of BTC/USD’s on-chain data on the same day makes it easy to check the direction of the bitcoin market and respond to it. Indicator 1 in Figure 11 shows the spot trading volume of BTCUSD or BTCUSDT on 9 major exchanges (Binance, Bitfinex, PoloniX, Bitex, Coinbase, Bitstamp, Kraken, HitbittyC, Gemini), and number 2. The indicator is by summing the trading volumes of BTCUSD or XBTUSD indefinite futures from 7 derivative exchanges (Binance Futures, OKX Futures, OKX Futures, Huobi Futures, FTX Futures, Kraken Futures, Delibit, BitMEX) in real time. Show.

<Figure 12=Comparison of total BTC spot trading volume and total BTC derivatives trading volume of major exchanges/Data=Aim Rich Financial Engineering Research Institute>

Bitcoin prices are converging to the lower $35,000. Looking at Index 1 in Figure 13, the spot trading volume continues to decline along with the market price decline, and today’s trading volume is higher than the previous day. However, if you look at the indicator in Figure 14, the total selling quantity is higher than the total buying quantity, so the bitcoin price is falling as of 14:00 on the 21st. In addition, although index 2 in Figure 13 shows that there is not much futures trading volume, daily price volatility is increasing a lot, so it seems to be cautious of the possibility of a sharp fluctuation during the intraday.

<Figure 13=Comparison of total daily BTC purchases and total sales of major exchanges/Data=Aim Rich Financial Engineering Research Institute>

② Bitcoin price and Korea premium index trend analysis <Neutral>

It is interesting to compare this trend after drawing the difference between the price of bitcoin listed on the domestic and foreign exchanges (hereinafter referred to as Kimchi Premium Index) on the bitcoin price chart. In the period of price increase, the bitcoin price is higher than the kimchi premium index, and in the period of price decline, the bitcoin price is lower than the kimchi premium index.

Although the prices of Bitcoin and Ethereum have fallen, the trend of Ethereum is still rising. However, both prices of kimchi premium indices rose above ‘0’ and the warning lights lit up. It is okay to keep buying, but it is necessary to observe that it does not cross.

<Figure 14=Bitcoin Price and Bitcoin Kimchi Premium Index Trend Comparison/Data=CryptoQuant>
<Figure 15=Ethereum Price and Bitcoin Kimchi Premium Index Trend Comparison/Data=CryptoQuant>

◇Analysis of the proportion of non-settled bitcoin options on the day <Neutral>

If you look at the result of analyzing the proportion of all outstanding contracts of Bitcoin options of Delibit (DBT) by hour on the 21st (see Figure 16), comparing the data analyzed at 10:00 and 14:00, calls in the open contract of the option due on the day Although the proportion of options remains at a higher level (approximately 63%) than put options, the share of selling call options is expected to exceed 2/3, resulting in a significant drop in intraday.

However, since the estimated price of the Delibit Bitcoin option payment (see Figure 17), which is due on the same day as simulated at 14:00, is expected to be around $35,000, there is a possibility that it will rebound to at least $35,000 around 5 pm after confirming the low. It is high, so please refer to this point and check the rebound flow of other coins.

<Figure 16=Analysis of all bitcoin options outstanding contracts issued by Deribit as of 10:00 (upper) and 14:00 (lower) on the 21st = Data/Data = Aimrich Financial Engineering Research Institute>
<Figure 17=Deribit (DRBT) BTC Option Simulation Result of Expected Water Settlement Price on January 21 (at 14:00)/Data = Aim Rich Financial Engineering Research Institute>

◇Bitcoin short-term price forecast according to bitcoin option data <weak>

It is known that in the cryptocurrency option market, the price of the underlying asset for the option’s expiration settlement tends to shift to the price that causes the most options to lose value by moving to the Max Pain Price. In other words, this price refers to the strike price with the largest number of call and put options, and the price that can incur financial losses to the largest number of option buyers at expiration.

As of 14 o’clock on the 21st, the maximum pain price for option buyers for each option is $35,000 on January 21 and $36,000 on January 22, which is not far from the current price range. It is expected to drop sharply to $28,000, and the up and down amplitude is expected to increase as well.

info@blockchaintoday.co.kr

Categories
News

Algorithmic asset experiments continue to entice traders & developers (www.blockcast.cc)

As the team behind Morph.Finance can attest, developing an algorithmic stablecoin project can be every bit as frustrating and thrilling as investing in one. 

While algorithmic assets have retreated from mid-December marketcap highs, the space has nonetheless continued to attract intrepid investors and developers aiming to position themselves at the forefront of a new financial vertical — though it remains an open question if such projects will ever achieve stability.

Largely formed in the mold of defunct 2018 project Basis, algorithmic assets are designed to automatically adjust the total circulating supply of a token based on preset conditions, such as time or price. While they’re ostensibly intended to hew to a peg, such as the US dollar, containing and mitigating volatility has proven to be a notoriously difficult problem to solve.

So far these assets have remained somewhat on the fringe of decentralized finance (DeFi), with the top three projects — Empty Set Dollar, Frax, and Dynamic Set Dollar — accounting for just half a billion in marketcap between them, per Coingecko. Yet traders keep lining up to take spins at the rebase casino, and there’s ongoing development into new products like BadgerDAO’s forthcoming DIGG — a synthetic asset meant to track the price of Bitcoin. It remains new, exciting, and largely unexplored territory.

A more stable stablecoin

In an interview with Cointelegraph, the anonymous developers of Morph.Finance — formerly Dynamic.Supply — recounted their story trying to build a sustainable project in the space, a story with just as many ups and downs as an algo stablecoin chart.

“Dynamic.Supply was a simple Basis fork with modified variables, which launched in early January,” said the team. “We tried to limit whale/bot accumulation by capping the maximum number of tokens per TX during the first hour of launch, but this was unsuccessful.”

The team explained that deep-pocketed ‘whale’ traders hoovered the tokens shortly after launch, and proceeded game the rebase parameters in their favor.

“There was no lockup on the boardroom initially, which opened us up to yield sniping, where users would buy and deposit large amounts of DSTR right before the end of an epoch, collect the rewards, then market dump everything before repeating a few hours later.”

The manipulation discouraged early community members and even some of the developers. Others, however, remained undaunted.

New features, new problems

As is often the case in startup stories, the obstacles led to ingenuity. In the case of Morph, the ingenuity came in the form of a Zapper contract allowing algorithmic stablecoin liquidity providers to quickly switch between other project pools to theirs. 

In the short term it bolstered liquidity, but in the long term it might also allow Morph to “introduce a market-wide LP zapper system that benefits all farms” — an innovation that could buoy the whole space.

But even the new on-ramps to the weren’t enough to stabilize the peg.

“Liquidity significantly improved, however our tokenomics were working against us,” the team said. “Emission of DST and DSTR were both far too fast, leaving us with insufficient time to get new arbitrage mechanics rolled out.”

In order to combat their overaggressive token emissions, the team deployed new contracts, rebranded, and asked the community to transfer their tokens — a process that led to significant griping about gas fees in social channels, as well as no small amount of anxiety that the team might be planning an elaborate rugpull.

Twitter trader @CryptoSpider1 was among those who held his stake through the migration to the new contracts, and said in a statement to Cointelegraph that “rugpull” risks are a part of being on the emerging frontier of the space.

“High risk = high reward, and the dev has shown he/she has no interest in rugpulling but creating something interesting that challenges the current model,” he said.

Next steps

As of 8 pm EST today, just a few weeks after launching as “Dynamic.Supply,” the project has reopened liquidity pools, completing Morph’s “metamorphosis” — converting DST and DSTR tokens to Morph Coin (MORC) and Morph Tracker (MORT), along with the new name, website, and emission rate. 

The Zapper feature — the first of what Morph hopes will be a series of contributions to the space — has also been carried over from the old brand.

A series of shuffles, tweaks, and innovations, all from a handful of devs and intended to push the algorithmic asset space forward.

It’s an open question as to if Morph’s changes will bring their asset stability, just as a similar concerns swirl around most, if not all algorithmic asset projects. But when asked about the future of Morph and projects like it, the Morph team already had further innovations on the mind.

“Utility! Without it, Morph, and all similar projects will eventually fizzle out. That’s not what we want, we’re aiming to build a sustainable ecosystem that we hope will bring real value to our users.”

Go to Source

Image Credit: Refer to Source
Author: Refer to Source Cointelegraph By Andrew Thurman

Categories
News

Bitcoin Momentum Likely to Continue as Bulls Shatter Critical Resistance (www.blockcast.cc)

  • Bitcoin has seen some massive momentum throughout the past few days, with the cryptocurrency’s price rallying to new highs over $30,000 as its uptrend turns parabolic
  • Where the cryptocurrency trends in the mid-term will undoubtedly depend on whether or not bulls can maintain full control of the crypto’s upswing or if it will post a blow-off top
  • Some analysts do believe that the lack of bid-side support just below BTC’s current price could result in it seeing a sharp drop if there’s a flurry of selling pressure
  • One analyst still believes that he expects its momentum to continue in the near-term
  • He notes that the break above $29,400 was what sparked this movement and that it will likely extend further in the coming days

Bitcoin has seen one of the wildest rallies of its history over the past few weeks, with its momentum only being rivaled by historic rallies like the one in 2017 and in years prior.

The crypto is now trading up nearly 10x from its 2020 lows of $3,800 set during the March selloff.

Its parabolic uptrend shows no signs of slowing down for the time being, and one analyst believes that it is only a matter of time before it sees further upside.

Bitcoin Explodes Past $30,000 as Uptrend Turns Parabolic

At the time of writing, Bitcoin is trading up over 12% at its current price of $33,100. This marks a massive upswing from recent lows of $26,000 set just a few days ago.

So long as buyers can maintain their control over the lower-$30,000 region, this could become a new floor for the cryptocurrency upon which it can expand off of.

Analyst: BTC Strength Shows No Signs of Slowing

One trader explained in a recent tweet that he is now watching for Bitcoin to continue this uptrend.

He notes that the break above $29,400 sparked this move higher and may continue creating tailwinds for it.

“BTC – $31k+: The momentum has been strong and breaking back above $29,400s was a key level. I’d expect the momentum to continue with Bitcoin to the upside. Now $19k-$20k Bitcoin doesn’t sound so bad – many now wish they bought more at those levels.”

Bitcoin

Bitcoin

Image Courtesy of Josh Rager. Source: BTCUSD on TradingView.

The coming few days should provide some serious insights into where the entire market will trend in the mid-term, as whether or not Bitcoin posts a blow-off top here will be telling as to its present strength.

Featured image from Unsplash.
Charts from TradingView.

Let’s block ads! (Why?)

Go to Source

Image Credit: Refer to Source
Author: Refer to Source Cole Petersen