Taking into account the rapid increase in U.S. bond yields, the elasticity of Bitcoin’s price trends compared with macro assets such as gold and stocks is still significant.
Original title: “Glassnode 丨Data on the chain shows that $47000 has become a strong support level for BTC? 》
Written by: CHECKMATE
Translation: Li Hanbo
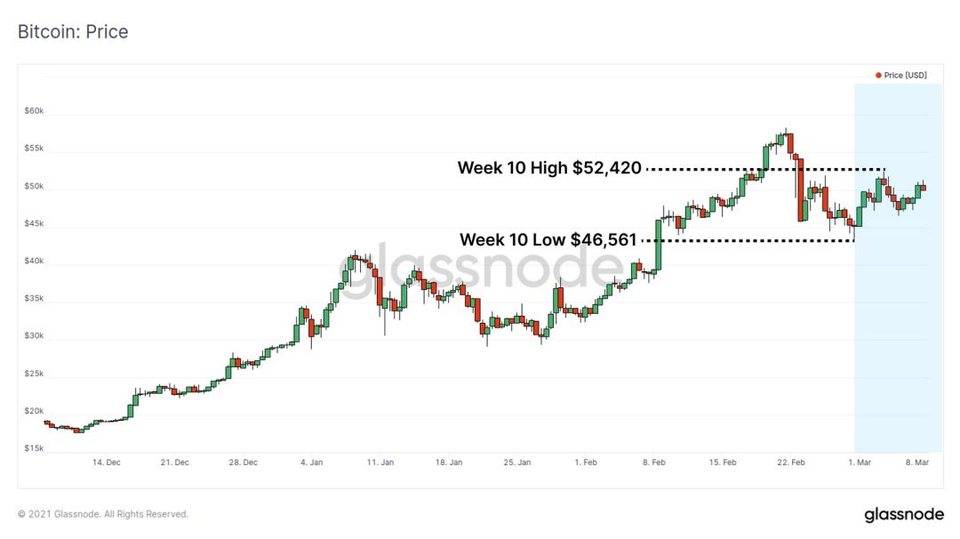
This week, the volatility of the Bitcoin market has decreased as it consolidates between a price high of $52,420 and a low of $46,561. What is impressive is that despite the weakness in both the stock and precious metal markets, the Bitcoin consolidation still held the 45k USD support level identified by Willy Woo in last week’s newsletter .
The strengthening of the US 10-year Treasury bond yield continued to strain the market. The yield rebounded by 10.7%, and this week closed at a 52-week high of 1.566%. The stock market’s performance was weak. The S&P 500 Index and the Nasdaq 100 Index fell 5% and 8%, respectively, and gold fell to a 38-week low of $1,730.
Putting Bitcoin alongside these macro assets, considering the significance of such a rapid revaluation of Treasury bond yields, the elasticity of its price movements is very significant.

Support on the chain
Last week Willy Woo pointed out that there are a large number of BTC trading on the chain around 45,000 USD, forming an on-chain support level . At the end of this week, @n3ocortex emphasized that this support level has actually been strengthened to over US$46,600, and 1.2 million BTC (accounting for 6.5% of the circulating supply) have been traded in this area.
When a large number of currencies move on the chain and the support level on the chain remains unchanged, this indicates that there is a lot of interest in hoarding coins, and buyers see it as a “value” entry point. Remember, although the chain support level has gradually strengthened since last week, if the price breaks below, it will become an equally strong resistance level.


In fact, if we look at the price distribution of UTXO, the on-chain support level of $47,173 is the largest since the price of $11,000. In addition, the active block on the chain shown in green in the figure below is not just a specific reserve price, but a large support area. We can see that there is a continuous and significant trading volume between 45.5k USD and 48.9k USD. This range now represents one of the largest accumulation levels of BTC on the chain in history-the largest since the last cycle’s $20,000 ATH was broken.
 URPD real-time chart
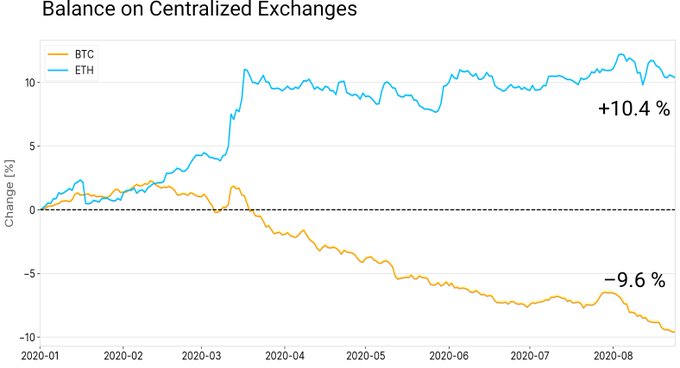
An important question we have to ask is whether this kind of on-chain transaction volume is related to hoarding coins, or is it the seller’s eagerness to withdraw. In the first step, we can observe that the BTC balance of the exchange continues to go down without interruption , and another 35,200 BTC withdrew this week.
 Real-time graph of exchange rate balance
Miner holdings
Miners are extremely optimistic participants of the Bitcoin network, but they have made huge CAPEX (capital expenditure) and OPEX (operating costs) investments in ASIC hardware and facilities. In other words, they are still sellers of BTC to pay for ongoing capital and operating costs .
If we investigate the balance of known miners, we can see that until the beginning of January 2021, miners’ holdings are increasing . Before 2021, the balance of miners will decrease, but the scale of the reduction is not comparable to the previous increase.
Please note that the miners shown below are only those we have identified (shown to provide a good visualization of this trend). There is also a large number of unknown miners (“other”), they represent an important part of the mining market, we will investigate them in the next picture.
 Miner Balances Live Chart
The miner’s position change indicator takes into account all the balances of all newly issued currencies, thus providing us with a global mining landscape. What we have observed is the peak of selling behavior throughout January (17,000 to 24,000 BTC/day), which can be largely attributed to some larger unknown miners (and even some early miners in 2010!) .
However, throughout February, we can see that the miners’ selling speed is decreasing, and nowadays, the bulls and bears are biased towards neutral. Although the newly issued coins account for only a small portion of the daily transaction volume (that is, the portion sold by the miners is small), it seems that even the miners are returning to a neutral or hoarding model .
 Miner Net Position Change Live Chart
Long-term position holders
Long-term holders (LTH) are classified as those who hold coins for more than 155 days, or those who withdraw to cold wallets.
In on-chain analysis, we must make assumptions around the behavior and incentive mechanisms of various network entities. For LTHs, we generally make an assumption that they have a good knowledge of Bitcoin and have high beliefs. Therefore, their coins tend to hoard coins in a bear market, stay in a dormant state for a long time, and regain a new life with their selling strength in a bull market trend.
The supply-adjusted CDD indicator is good at tracking this type of LTH behavior. The longer a Bitcoin is dormant, the more “coin days” it can store. As more old coins are spent and more coin days are destroyed, the CDD indicator will show an upward trend .
 CDD real-time graph after supply adjustment
The above figure shows that from October 2020 to January 8, 2021, LTHs did indeed begin to sell (CDD is on an upward trend). However, since January 8th, LTHs have slowed down this behavior. The 7-day and 30-day moving averages of CDD have both returned to high levels, but it is not uncommon for the early bull market or even a bear market. This indicator shows that, similar to miners, LTLHs are also making profits, but they are certainly not in a hurry to flee .
To further increase the weight of this argument, we can look at the net balance of these LTHs. We see a pattern that is almost the same as that of miners, that is, from the end of 2020 to the beginning of January 2021, there was a peak of selling, and then a sharp slowdown. In terms of net value, LTHs are still distributed at a rate of approximately 44,500 BTC per day, but this only accounts for less than 5% of the daily trading volume of the futures market, and the trend is to reduce expenditures.
 Real-time graph of net position changes
The situation of short-term position holders
Finally, we will study the behavior of short-term holders (STH) who hold coins for a relatively short period of time (<155 days). STHs usually account for most of the daily traffic on the chain. In on-chain analysis, we usually assume that STHs are short-lived users, speculators, and day traders who are more sensitive to price fluctuations .
First, let’s review the relative supply held by STH wallets, which are profitable (the coins that have been held for a short period of time are finally moved at a cheaper price, green) and the wallets that are now in a loss state (red). During the rebound to the current ATH of $58,300, more than 5.12 million STH holdings of BTC were profitable.
When this correction sold to a low of $ 43,300, more than 1.14 million of these BTCs became losses, and another 10,200 BTC was bought at the beginning of the correction (and then fell into a loss) .
This shows that in the past two weeks, about 112,000 coins have been transferred from LTH to STH, and above $45,000, STH has accumulated 1.25 million BTC (this is also in line with the tweet by @n3ocortex and our in this article The URPD at the beginning of the article is the same).
 STH profit and loss supply real-time graph
We can increase the weight of these profit and loss dynamics by observing the STHs expenditure output profit rate. This indicator looks at how much profit all UTXOs classified as STH achieved during the day’s sell-off.
-
SOPR> 1.0 means that the day is profitable
-
SOPR = 1.0 means that no profit or loss was realized on the whole day.
-
SOPR<1.0 means that if you sell on that day, you will lose money.
Last week, we saw SOPR reset below 1.0. We theoretically believe that this is the first indicator of new retail investor losses . This week we saw SOPR-STH pull back above 1.0, despite the sideways price consolidation.
This second SOPR reset is healthy because it represents the belief in STH’s bargaining. In the past, the retest of SOPR after falling below 1.0 generally marked the cessation of the downward correction, and in this bull market cycle, the price upward momentum has also followed .
 STH SOPR Live Chart
Weekly Bitcoin market summary
The above on-chain analysis is a typical workflow that we use to evaluate the emotions and behaviors of different network participants under a set of behavioral assumptions. In order to maximize the value of insights on the chain, we must seek a convergence between multiple indicators to improve our accuracy and probability of correctness.
This week, we have:
- Despite the turbulence of the macro market and the weakness of the traditional market, Bitcoin is still consolidating sideways above the strong on-chain support level (maintained last week).
* The on-chain support of USD 45k has actually strengthened the exchange of more than 1.2 million BTC, and even raised the bottom line of support to the range of USD 46.6k to USD 47k**.
-
After several months of selling, the miners slowed down their selling behavior. Compared to BTC’s daily trading volume and miners’ hoarding of coins before 2020, this selling volume is very small .
-
Long-term holders slowed down the sell-off after the sell-off that started in 2021. Many of our longevity indicators (such as CDD and ASOL) have dropped significantly (meaning fewer old coins moved), and the selling speed of LTH balances has also decreased .
-
Short-term holders (assuming new investors/speculators) have already suffered losses last week and bought the lower limit. This week their belief in lower limit buying has been put to the test. More coins were transferred from LTH to STH. However, we did not see another SOPR below 1.0, indicating that we did not get more panic selling .
The data on the chain shows that Bitcoin’s bull market this week is relatively strong. The main risk one must bear in mind is that the key chain support level between $45,000 and $47,000 falls, and many of our observations may change from a strong support level to a heavy resistance level.